Zane Bergen

* shot by Zane Bergen

Zane Bergen

Data driven. Outdoor inspired.

About

Most of my work starts by gathering my own primary data from scratch. Driven by a passion for health and performance, I’ve spent the last twelve years logging every run on a Garmin, and more recently every night of sleep on an Oura Ring. I’ve built statistical models and machine learning tools from the ground up to optimize my training, sleep, and recovery.

I earned a B.S. in Management Science and Engineering from Stanford in 2026 and I am currently pursuing a Master of Business Analytics at the UW’s Foster Business School. Recruited to compete in cross country and track at both universities, I was captain of Stanford’s team and now run for the Huskies. Outside of school and running I co-founded Vantle, an AI-native assessment platform for university professors.

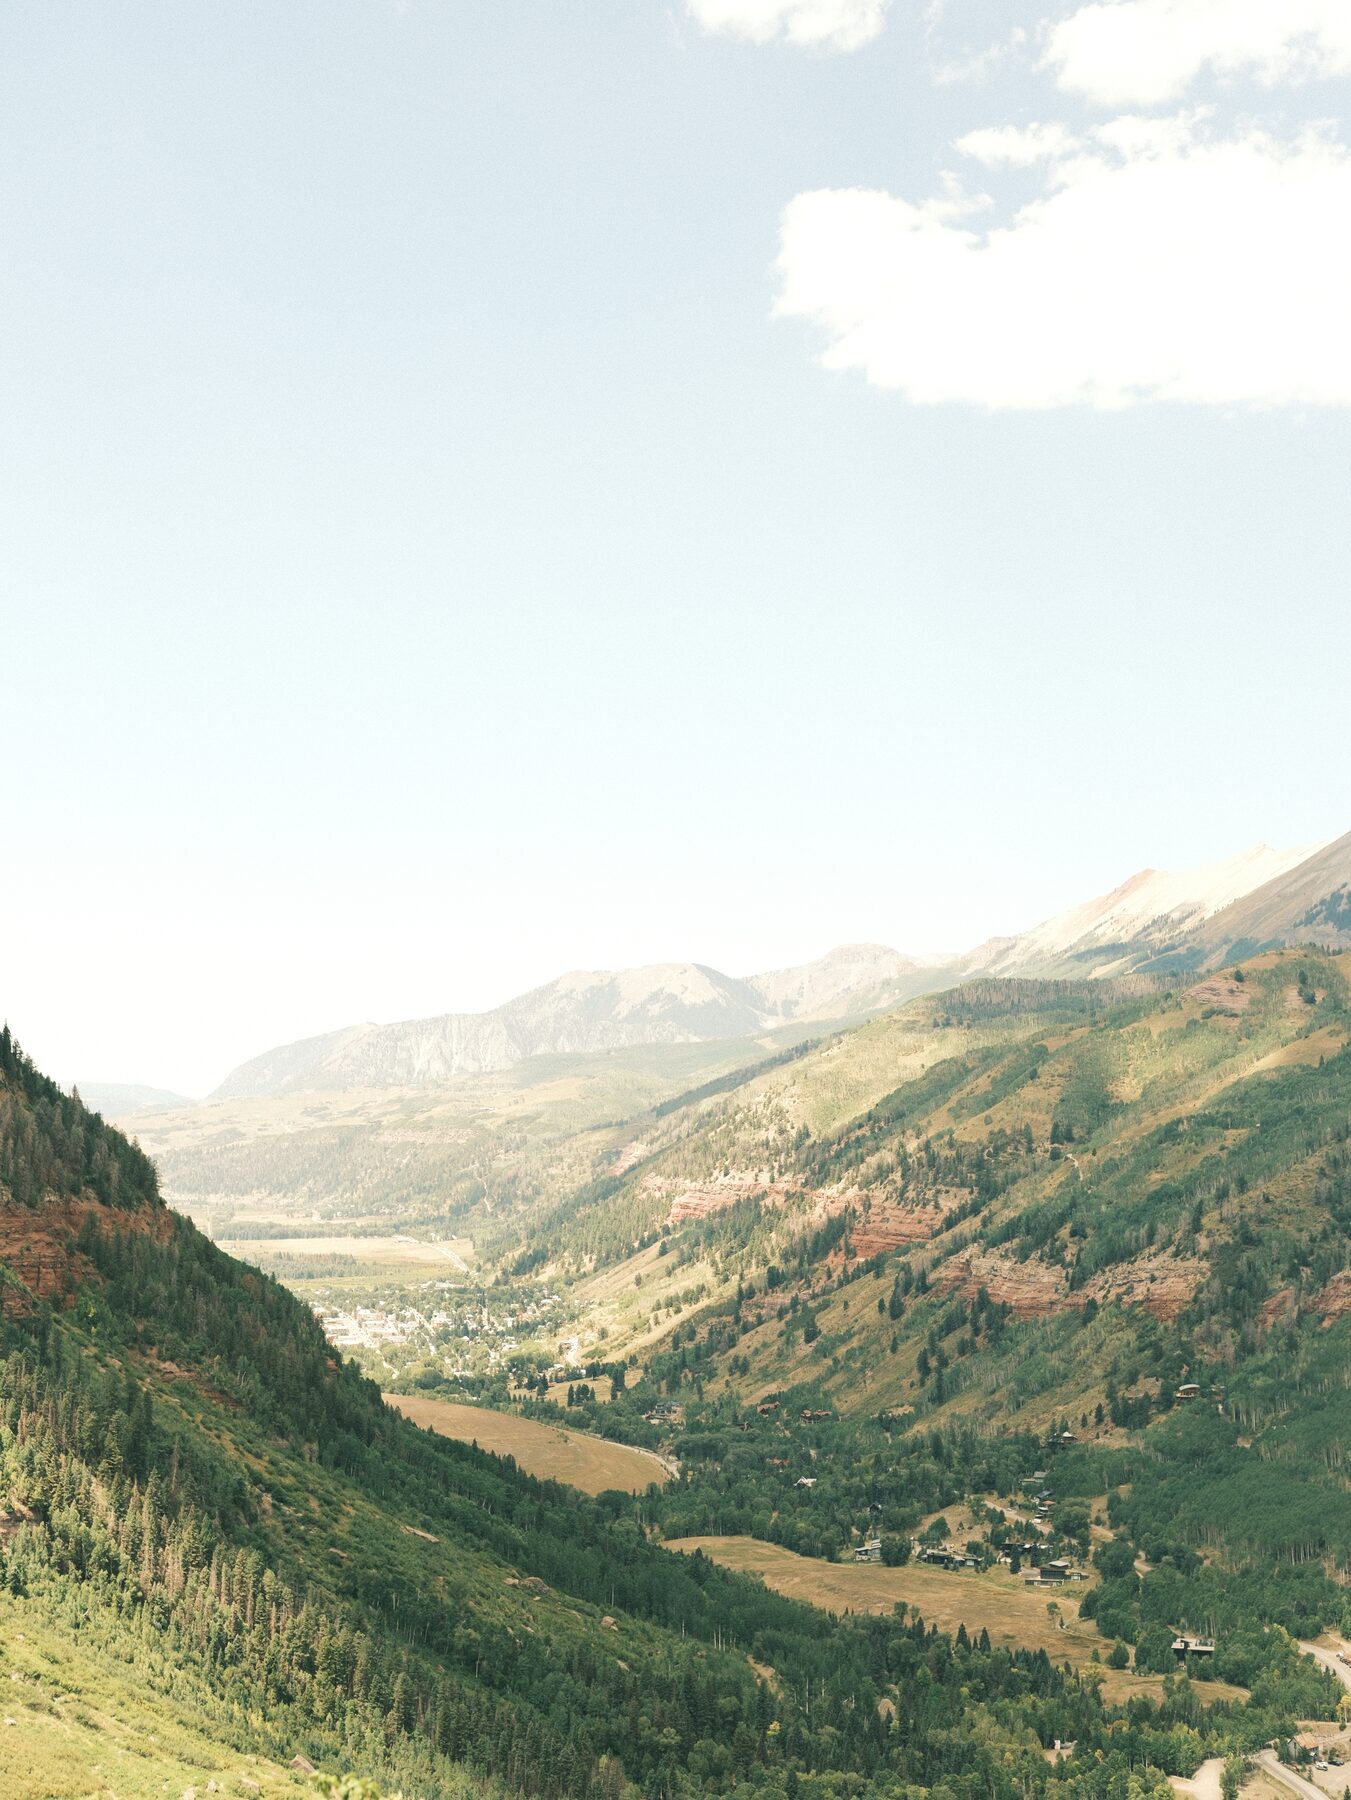
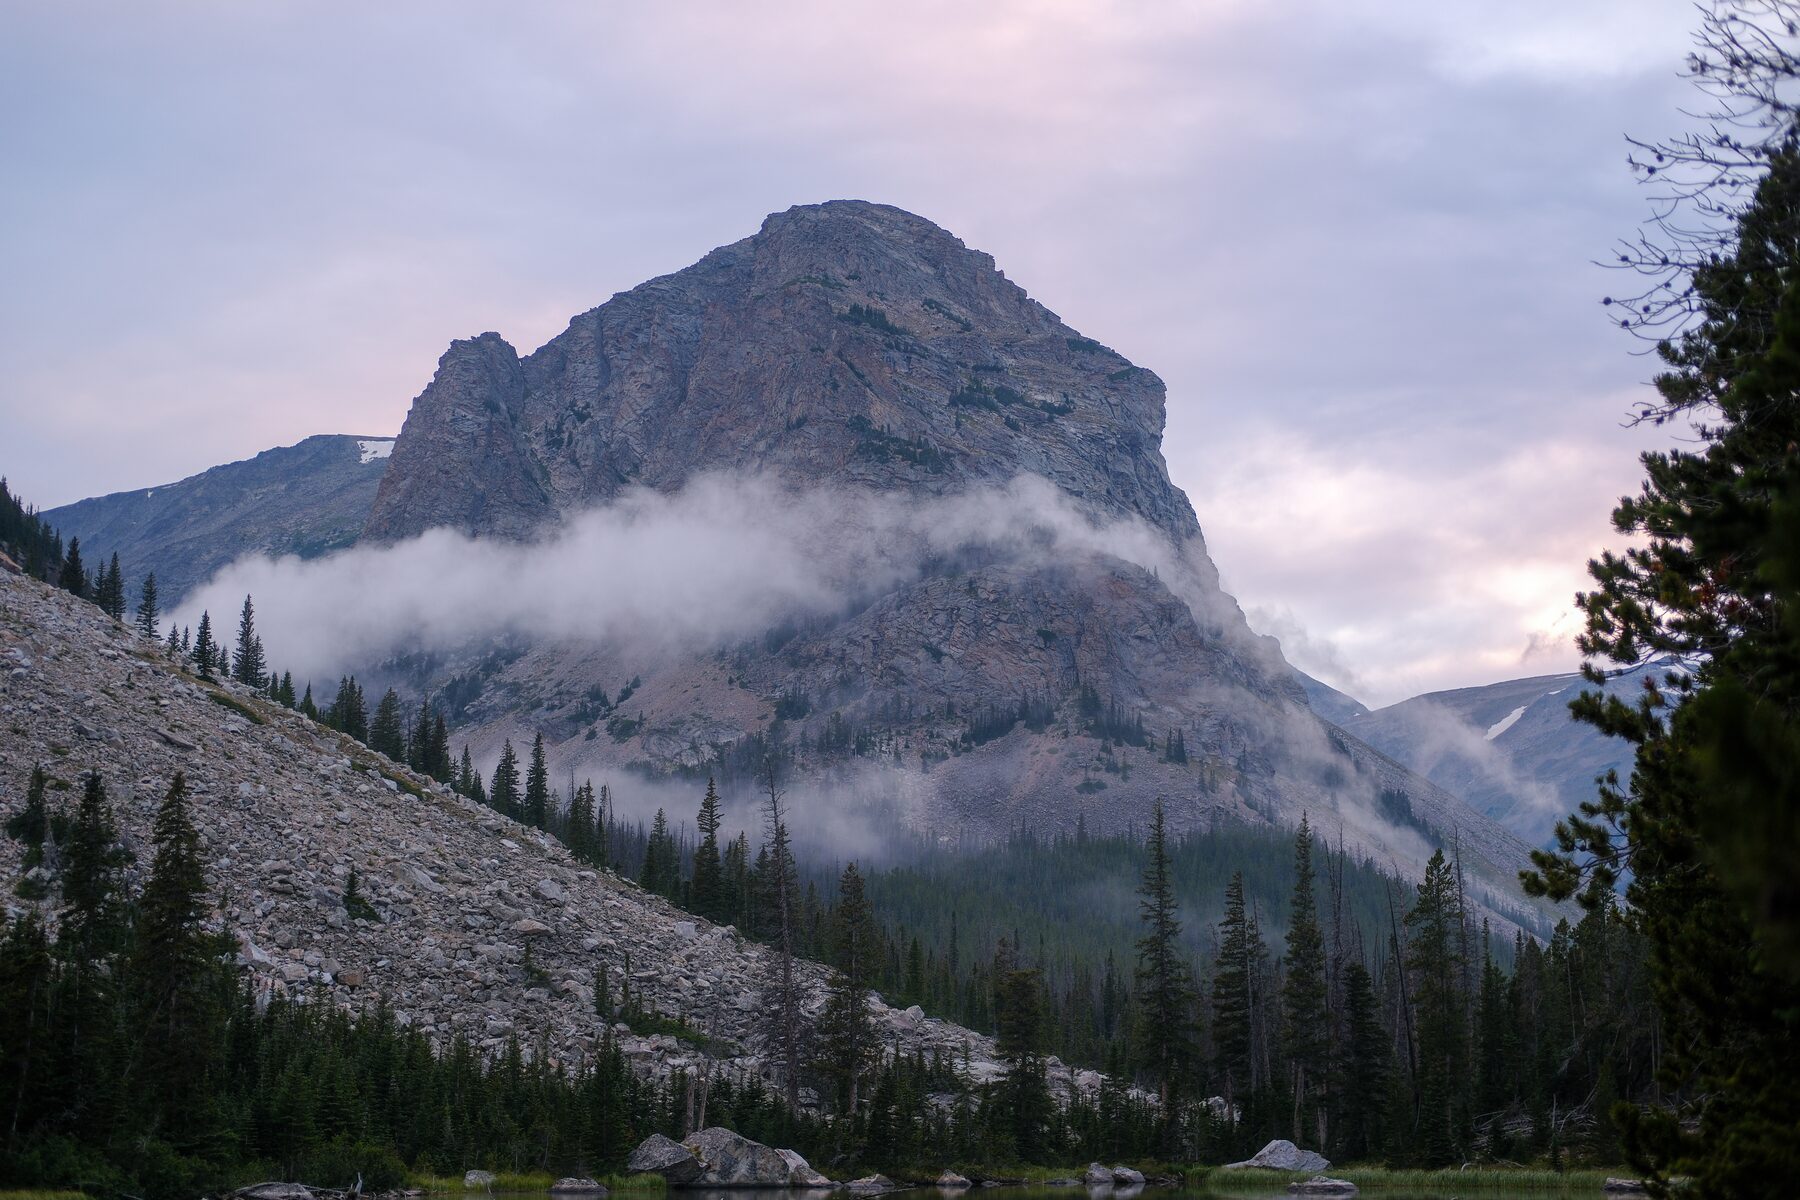
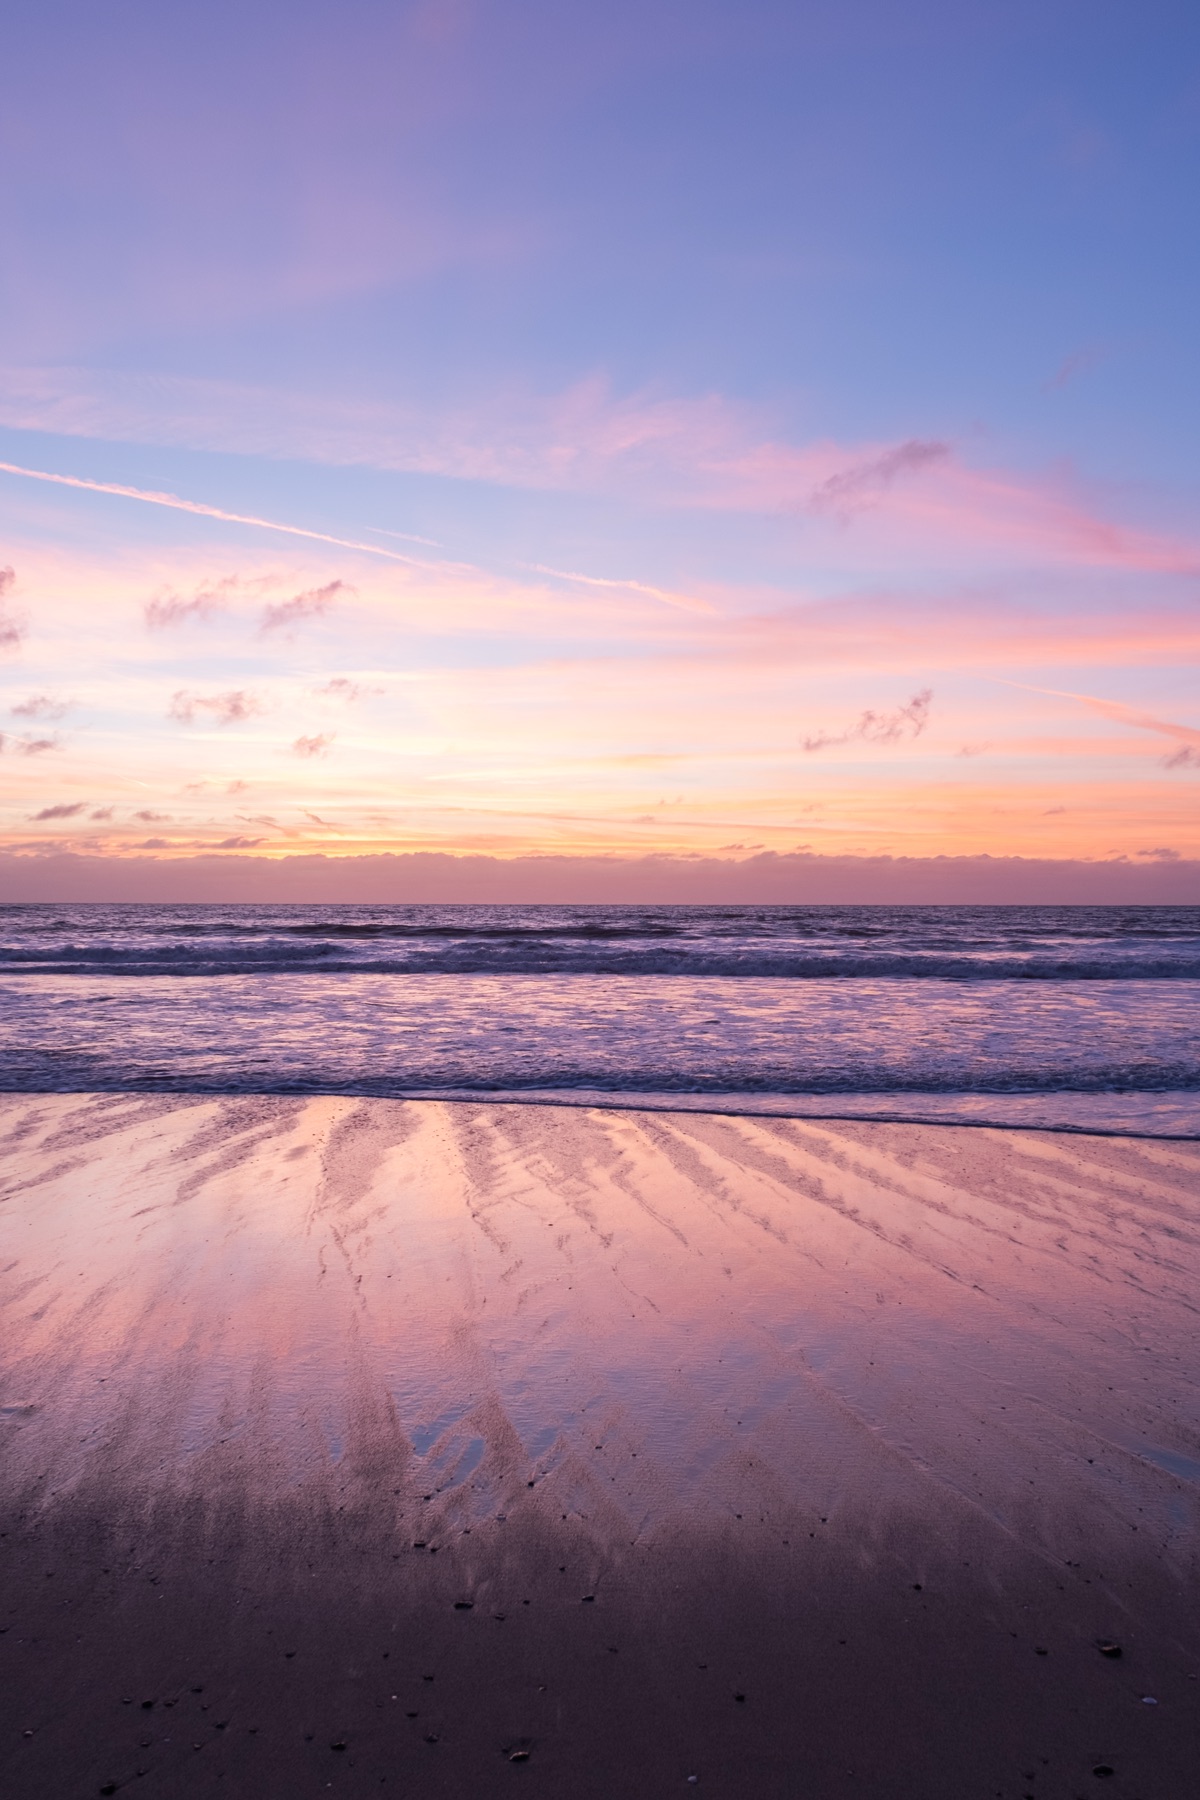
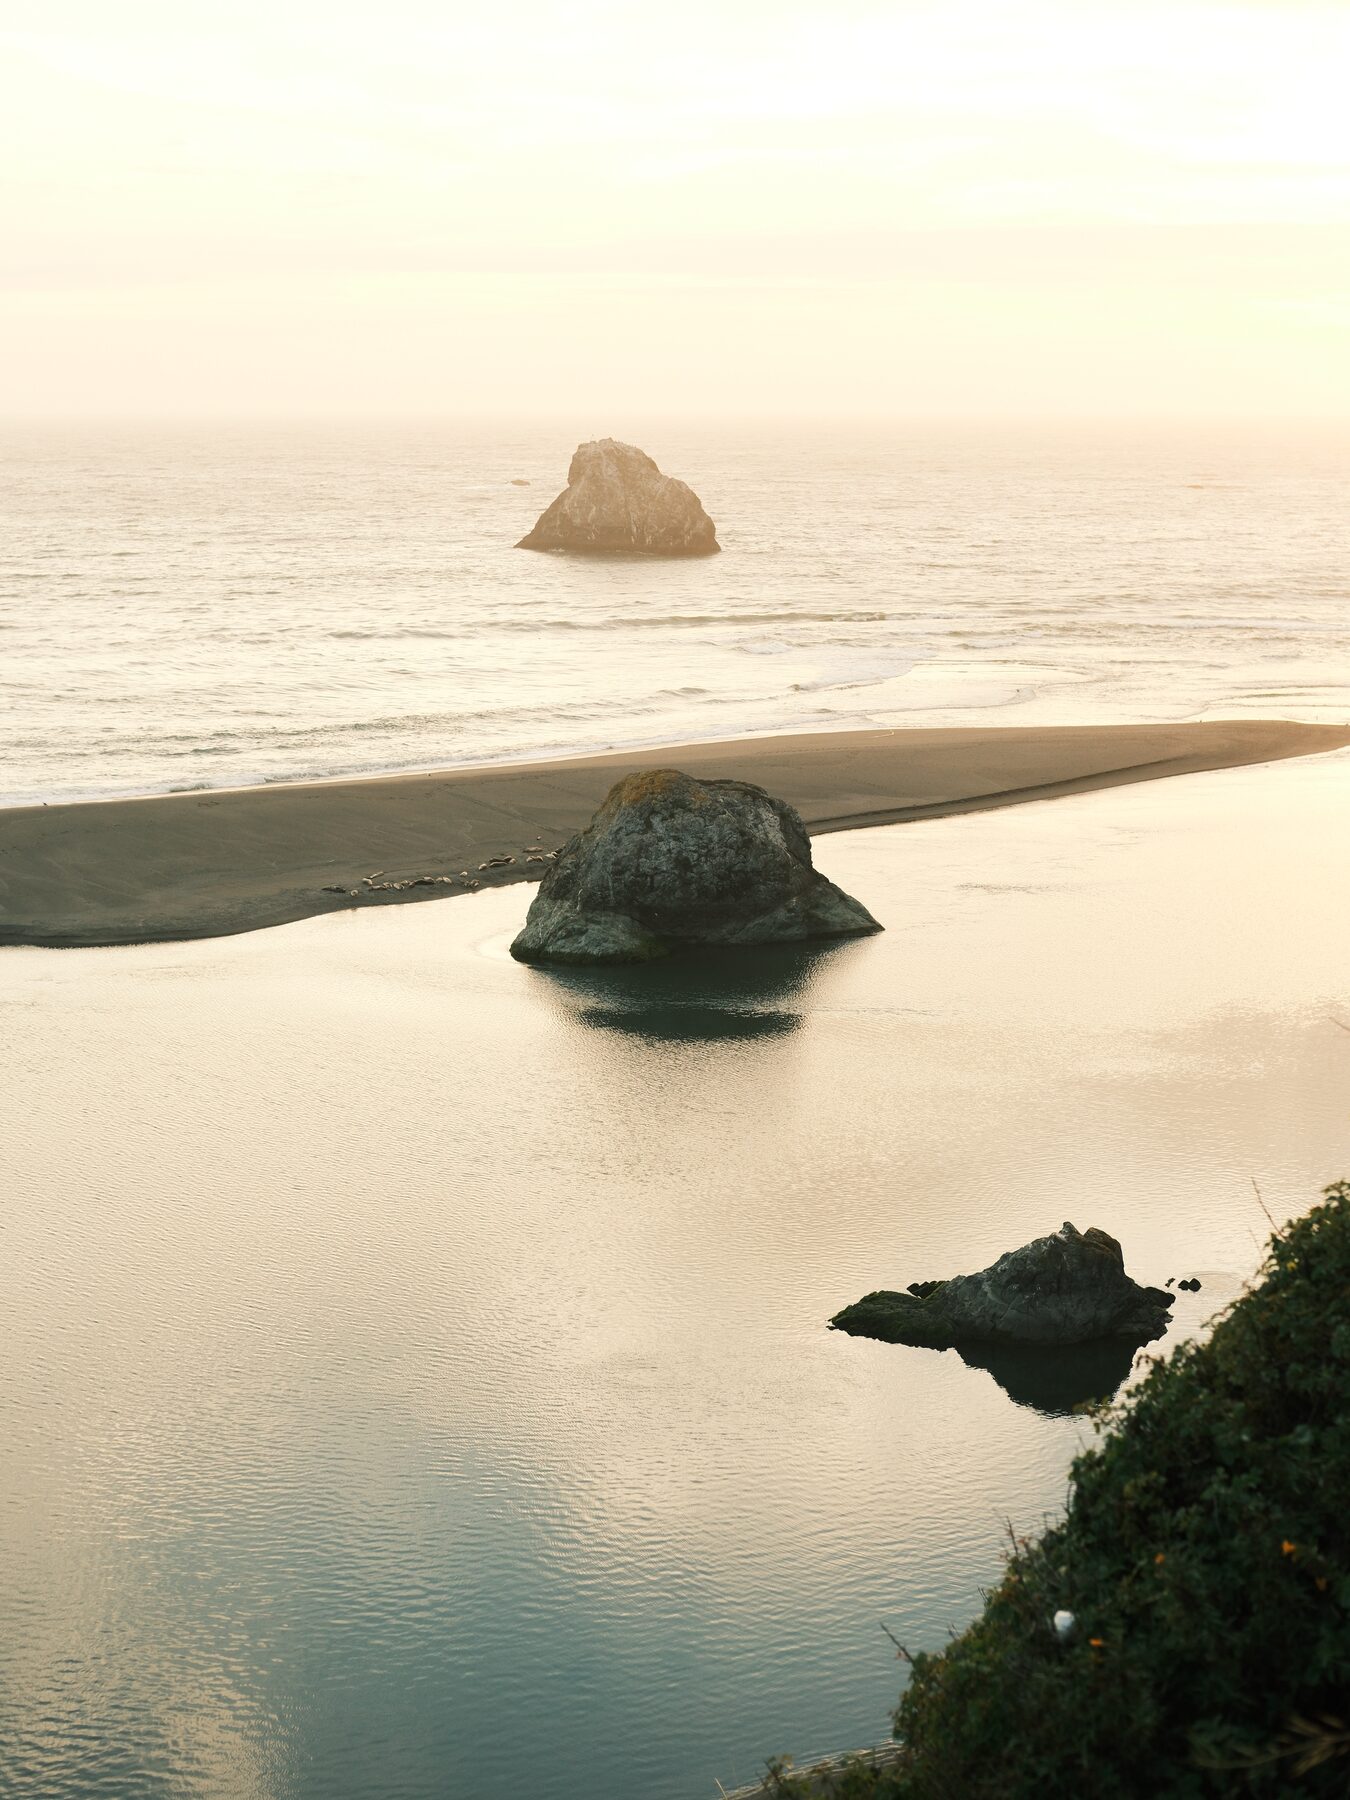
In my remaining free time, you’ll find me with a fly rod, a backpack, and a camera. (All photography on this site is my own.)

Zane Bergen in front of Memorial Church at Stanford
Memorial Church, Stanford · 2026

Work

Things I've made.

Three projects broken down simply: The challenge, the three steps, and the results.

Nightbrain

iOS App · In Progress
Problem

Sleep apps often reduce your sleep to a standardized score broadly applied to all users. The number I care about is directly related to how rested I feel, and that relationship is different for each person. None of the apps I used were fitting a model to my individual sleep patterns and how rested I felt each day.

What I did
  1. Built an iOS app in Swift and SwiftUI that pulls each night from the Oura API and pairs it with a one to five rating the next morning. The rating is the label and the biometrics are the features.
  2. Fit an n-of-1 model that refits itself every night, entirely on the device. The data lives in a local GRDB database and never leaves the phone.
  3. Designed the whole thing around honest uncertainty. Last night's data stays locked until you rate it, and no weight is shown until it clears a confidence threshold.
Result

A working build that gets progressively more defined each morning. Early on the honest answer is usually "too uncertain to say", and the app is allowed to say it. The screens below walk through one morning.

The full loop. Rate the morning, unlock last night, check the model, then the history calendar.
Nightbrain's morning screen asking how rested you feel, with buttons one through five
Rate before you look. The morning opens with one question and nothing else on screen, so the number on your wrist cannot bias the label.
Nightbrain's last-night view: sleep metrics and tonight's signal
Last night, unlocked. Nine Oura metrics for the night you just rated, plus one sleep signal explained in plain language.
Nightbrain's model view: predictions versus ratings, and what the model weighs
Your model. The line is the prediction and the dots are your ratings. Below it, bars fill as evidence accumulates. A check means a weight has cleared the threshold, a question mark means it has not yet.
nightbrain.app Swift · SwiftUI · GRDB · Oura API screens shown over demo data

Garmin Workout Classifier

Machine Learning · Personal Data · 2026
Problem

Garmin and Strava log a run as one data point. A ten mile day with six kilometer repeats inside it looks the same as an easy ten. Effort needed to be added to the equation. I wanted to build a dataset of my 12-year running history, accurately labeling all 3,370 individual workouts by type.

What I did
  1. Parsed every FIT file into a uniform one-second series and split each run wherever the pace shifted, using PELT change-point detection. That produced 32,213 segments.
  2. Clustered the segments into seven effort states with k-means. Every segment is scaled against a trailing 90 day window, so hard means hard at that month's fitness rather than my all-time best.
  3. Hand labeled 272 runs blind, wrote a transparent nine-rule baseline, then trained a gradient-boosted model on features describing how each run is composed.
Result

The gradient-boosted model reaches 79.7% strict accuracy on out-of-fold test runs, 22 points above the rules baseline. The labeled corpus, 2,969 runs that are roughly 70% easy and 20% quality work, is the foundation for the next stage, predicting race times from training history.

79.7%strict accuracy
+22 ptsover the rules baseline
3,370runs, 2014 to 2026
Three pace traces colored by effort state: a tempo run, an interval session, and a normal run with strides
Three runs, colored by effort state. Look at the middle panel, an interval session. The model separates each rep (orange) from the recovery jog between them. A whole-run average would call this a moderate seven miler.
Stacked bars of aerobic base, threshold, and VO2 work by year from 2018 to 2026
Training mix by year. Roughly one run in six is a workout, and the split between aerobic base, threshold, and speed has been steady since 2022. This is the kind of question I could not answer before the labels existed.
GitHub Python · pandas · scikit-learn · ruptures

Predicting Accident Cleanup Time

Data Science · Stanford MS&E 226 · Team of 3
Problem

When a crash closes a road, neither navigation apps nor traffic agencies have a good estimate of how long it will stay closed. We asked whether public accident data could predict clearance time well enough to route around it.

What I did
  1. Drew a stratified sample of 100,000 crashes from 7.7 million U.S. accidents (2016 to 2023), engineered clearance time as the target, and removed every column that leaked the answer.
  2. Cross-validated five regressors, from an OLS baseline and ridge through random forest and two flavors of k-nearest neighbors, one of them with TF-IDF text features from the crash descriptions.
  3. Ran inference on the linear model with a Benjamini-Hochberg correction to see which predictors actually held up on the test set. Only six numeric features and two road indicators survived.

With Nick Narey and Trevor Moore. I owned the OLS baseline, the ridge pipeline, and the statistical inference.

Result
Don't
deploy.

The best model, k-nearest neighbors with k = 3, is still 28.5 minutes off on held-out crashes, and the OLS baseline explains 3% of the variance. The drivers that matter, vehicle type, impact speed, injuries, and responder resources, are not in public data. We recommended against shipping it.

Line chart of test RMSE against number of neighbors, bottoming out at k = 3 with 28.48 minutes
The best we got. Test error for KNN as k grows. The curve bottoms out at k = 3 and 28.5 minutes, and nothing else we tried got meaningfully lower.
Correlation heatmap of numerical features; the clearance time row is near zero everywhere
Why. The bottom row is the target. Every feature correlates with clearance time at 0.08 or less, which is the whole story in one picture.
GitHub Python · scikit-learn · statsmodels

More landing here as the MSBA goes on.

Athletics

Running.

Beyond competition, running has instilled a lifelong commitment to discipline, resilience, and the pursuit of long term goals over immediate gratification. I grew up in Boulder, CO, famous for its high altitude and vast trails. Boulder has an amazing running culture where everyday runners train alongside world champions every day.

My years running at Niwot High School ultimately led me to Stanford, where I had the opportunity to compete in both cross country and track. I am most proud of serving as team captain my senior year.

After graduation in June of 2026, I was recruited to run my final year of eligibility at UW Seattle as a graduate student. I am running for the Huskies while getting a Master of Business Analytics, specializing in the 800m and 1500m. My favorite distance is the 1500m for its mix of speed, strategy, and pure grit!

Now
UW Huskies 800m and 1500m
2022 to 2026
Stanford cross country and track, team captain
Conference
ACC Championships, 1500m · ACC Academic Honor Roll
High school
Gatorade Colorado Player of the Year · Colorado Running Hall of Fame
Logged
3,370 runs since 2014, every one of them in the classifier above
Zane crossing the finish line at night in a Stanford singlet, arms raised, ahead of a Washington runner Zane leading the pack off the final bend at the Boston University indoor track Zane mid-stride on the backstretch at the Stanford Invitational

Photography

Off the clock.

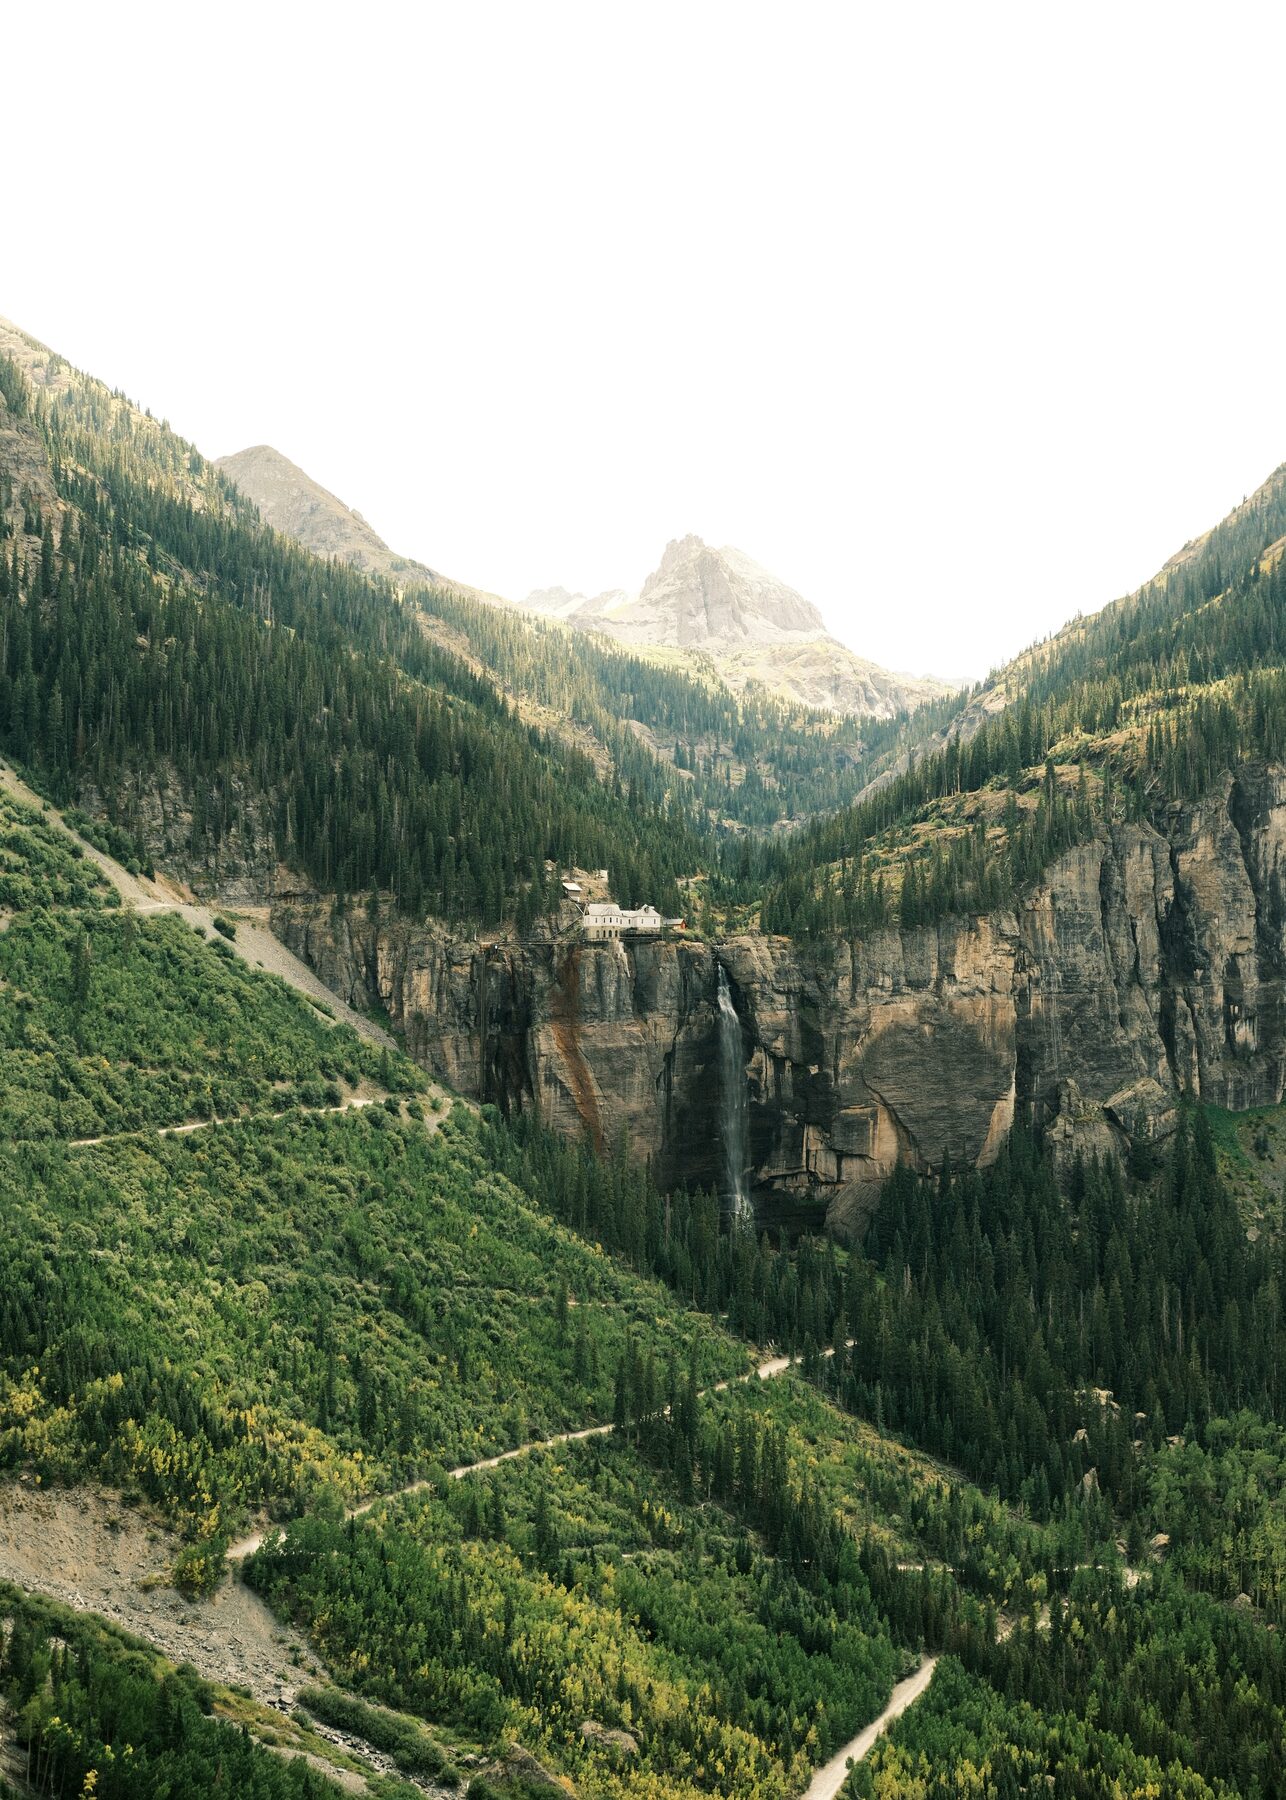
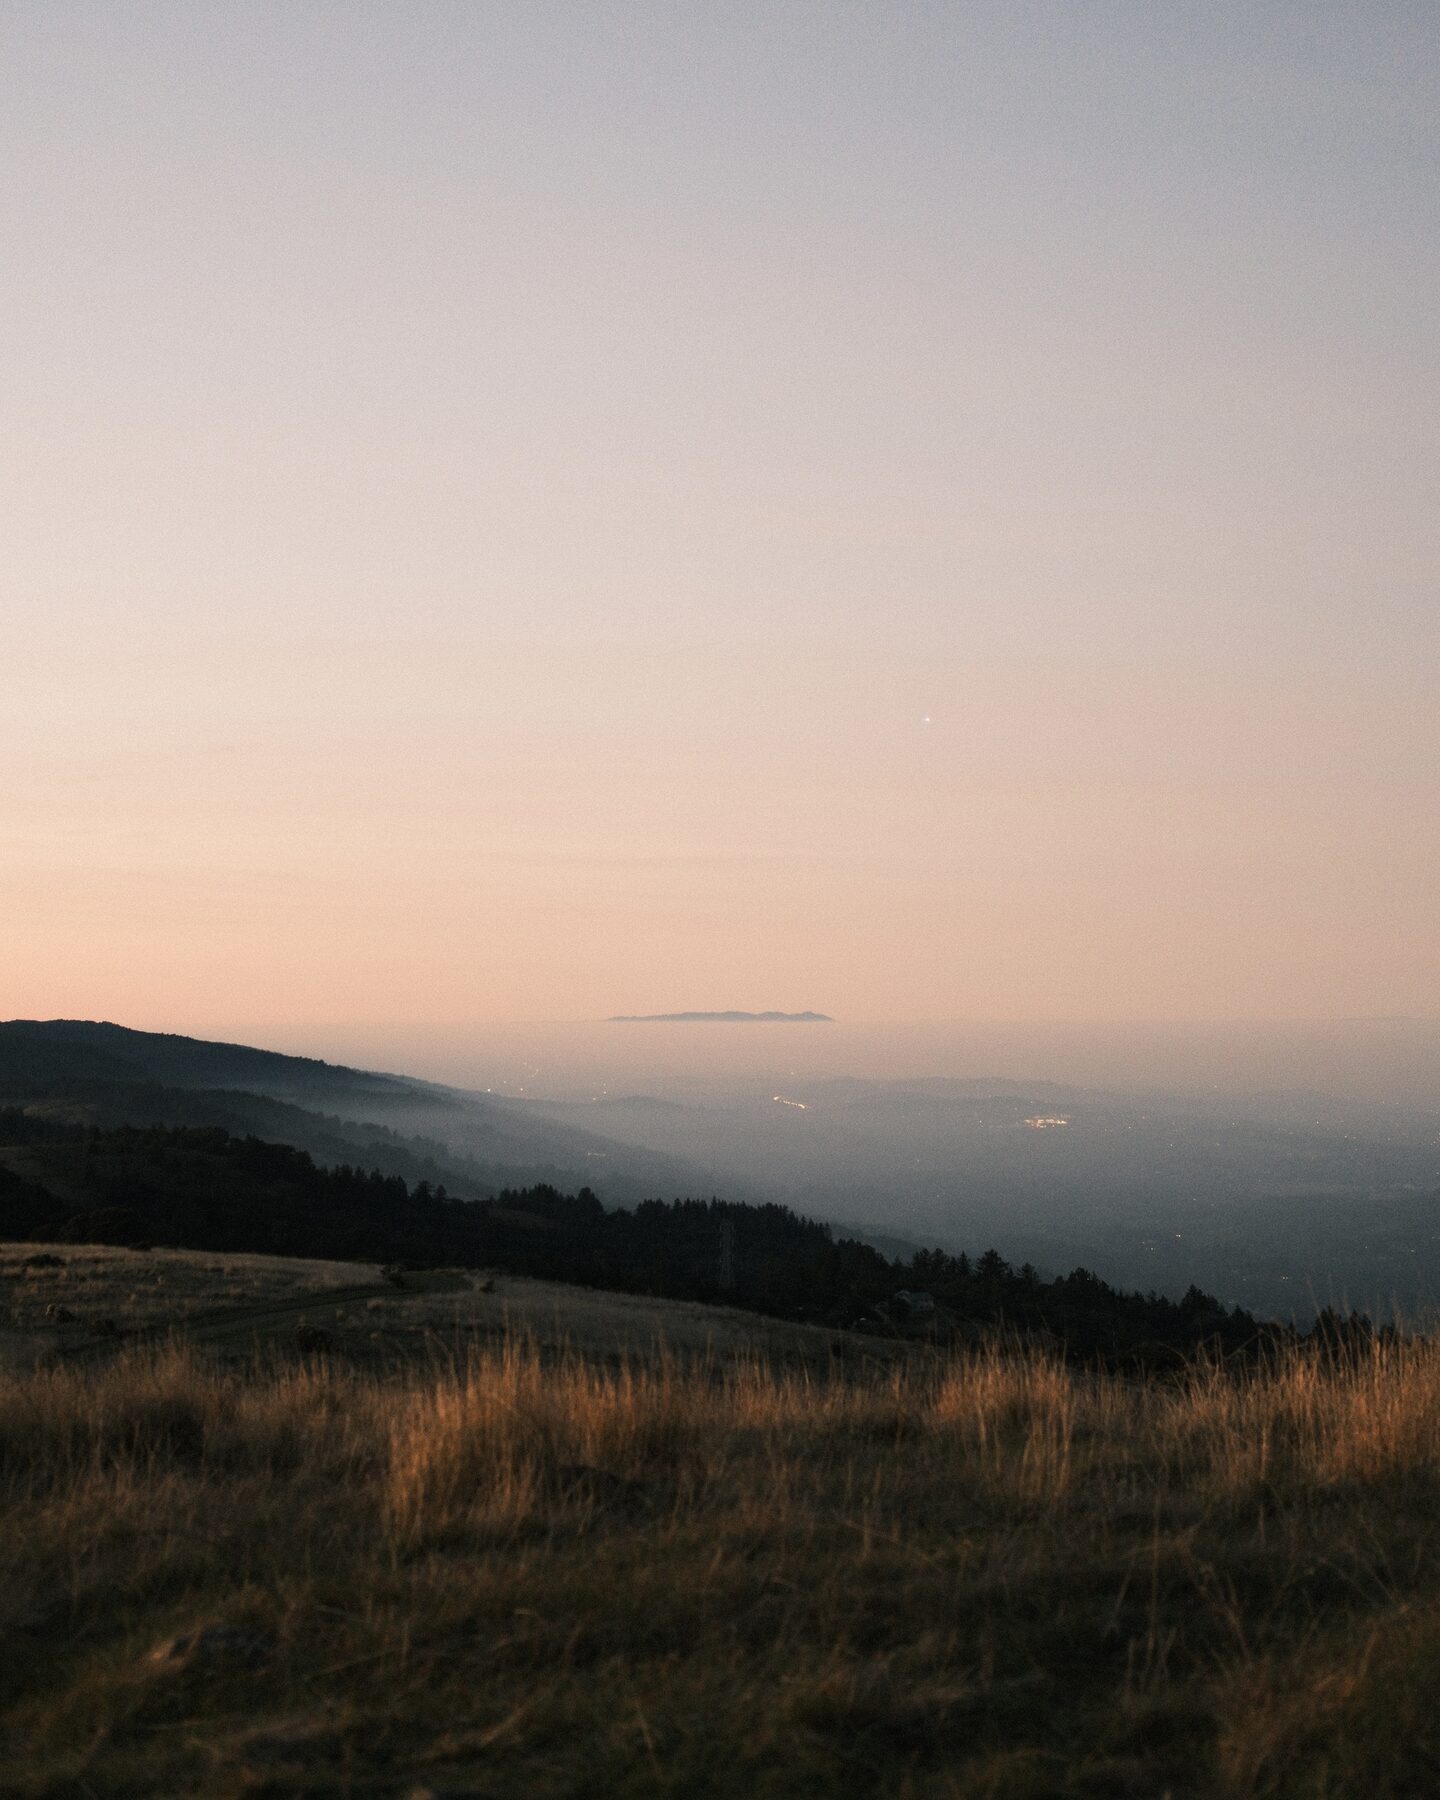
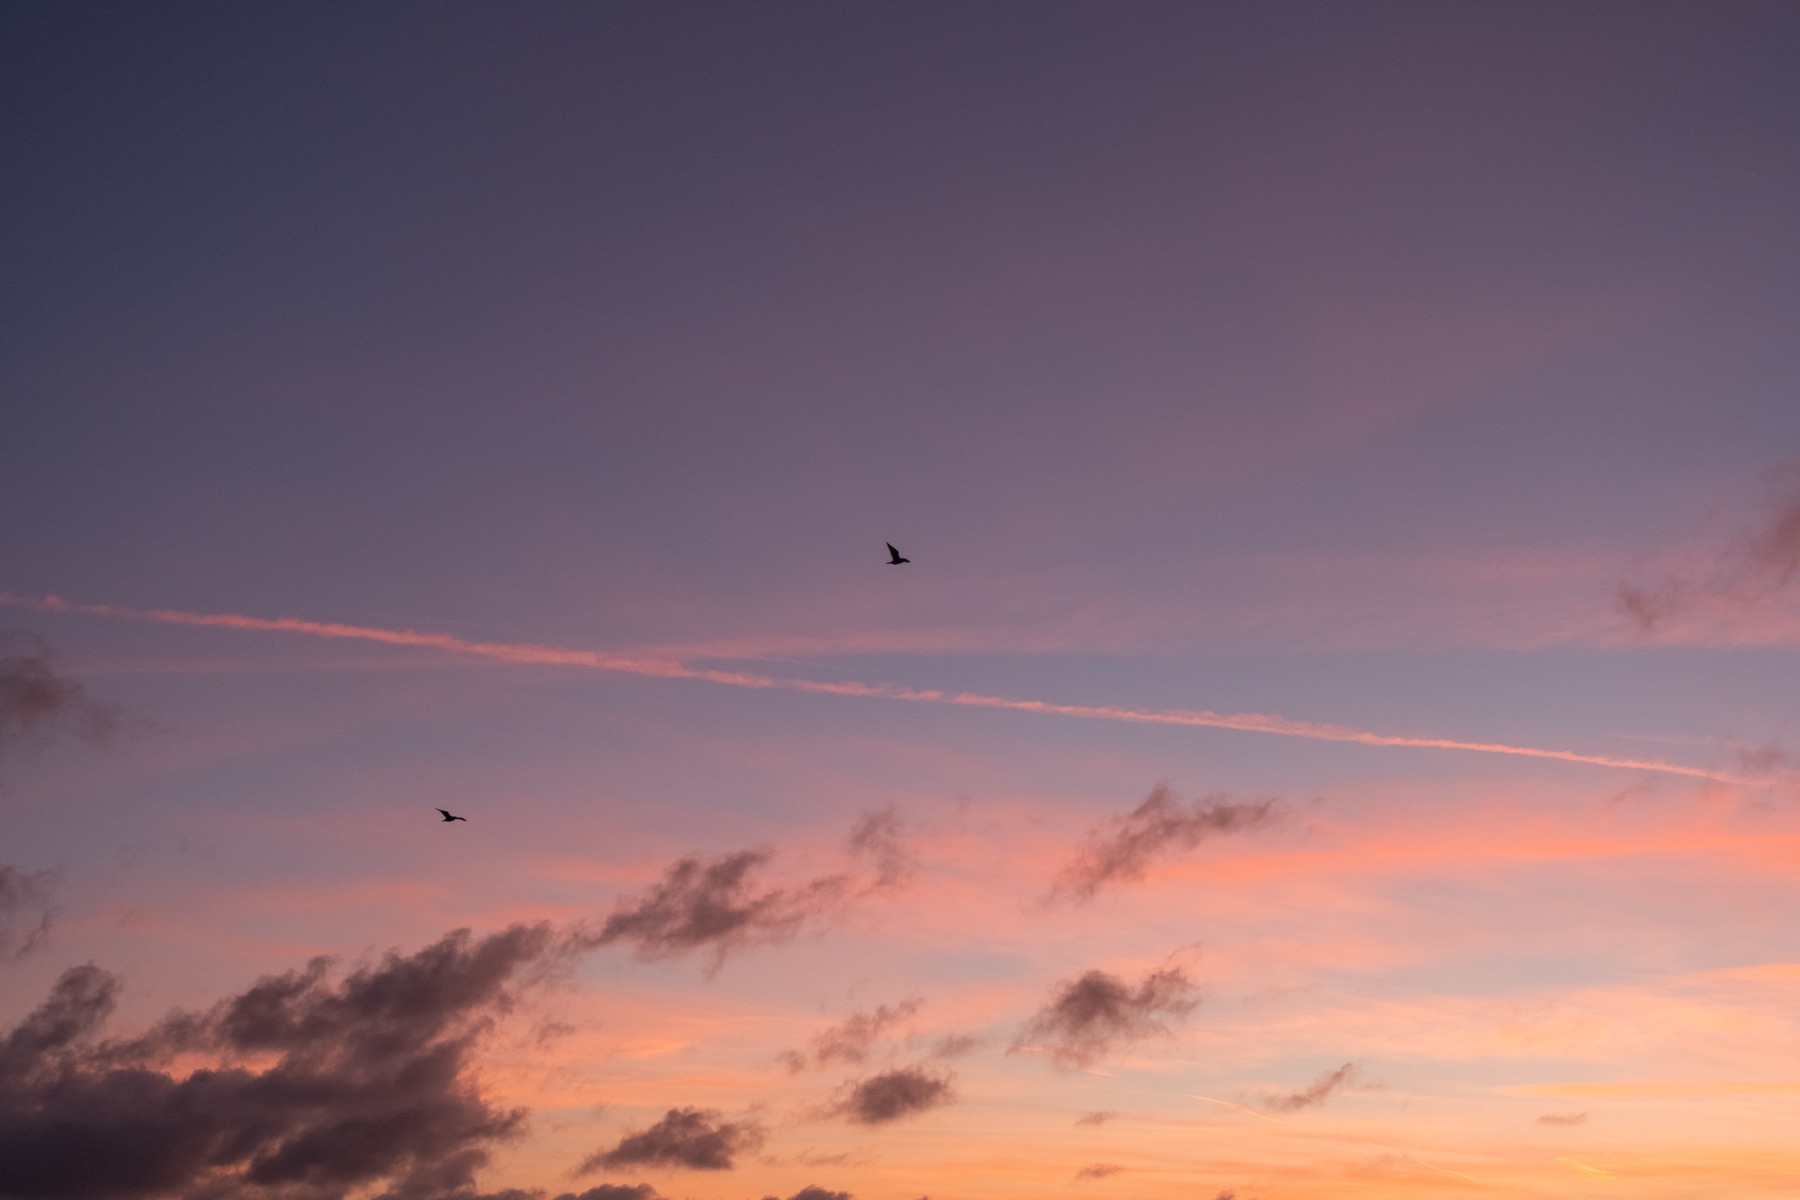
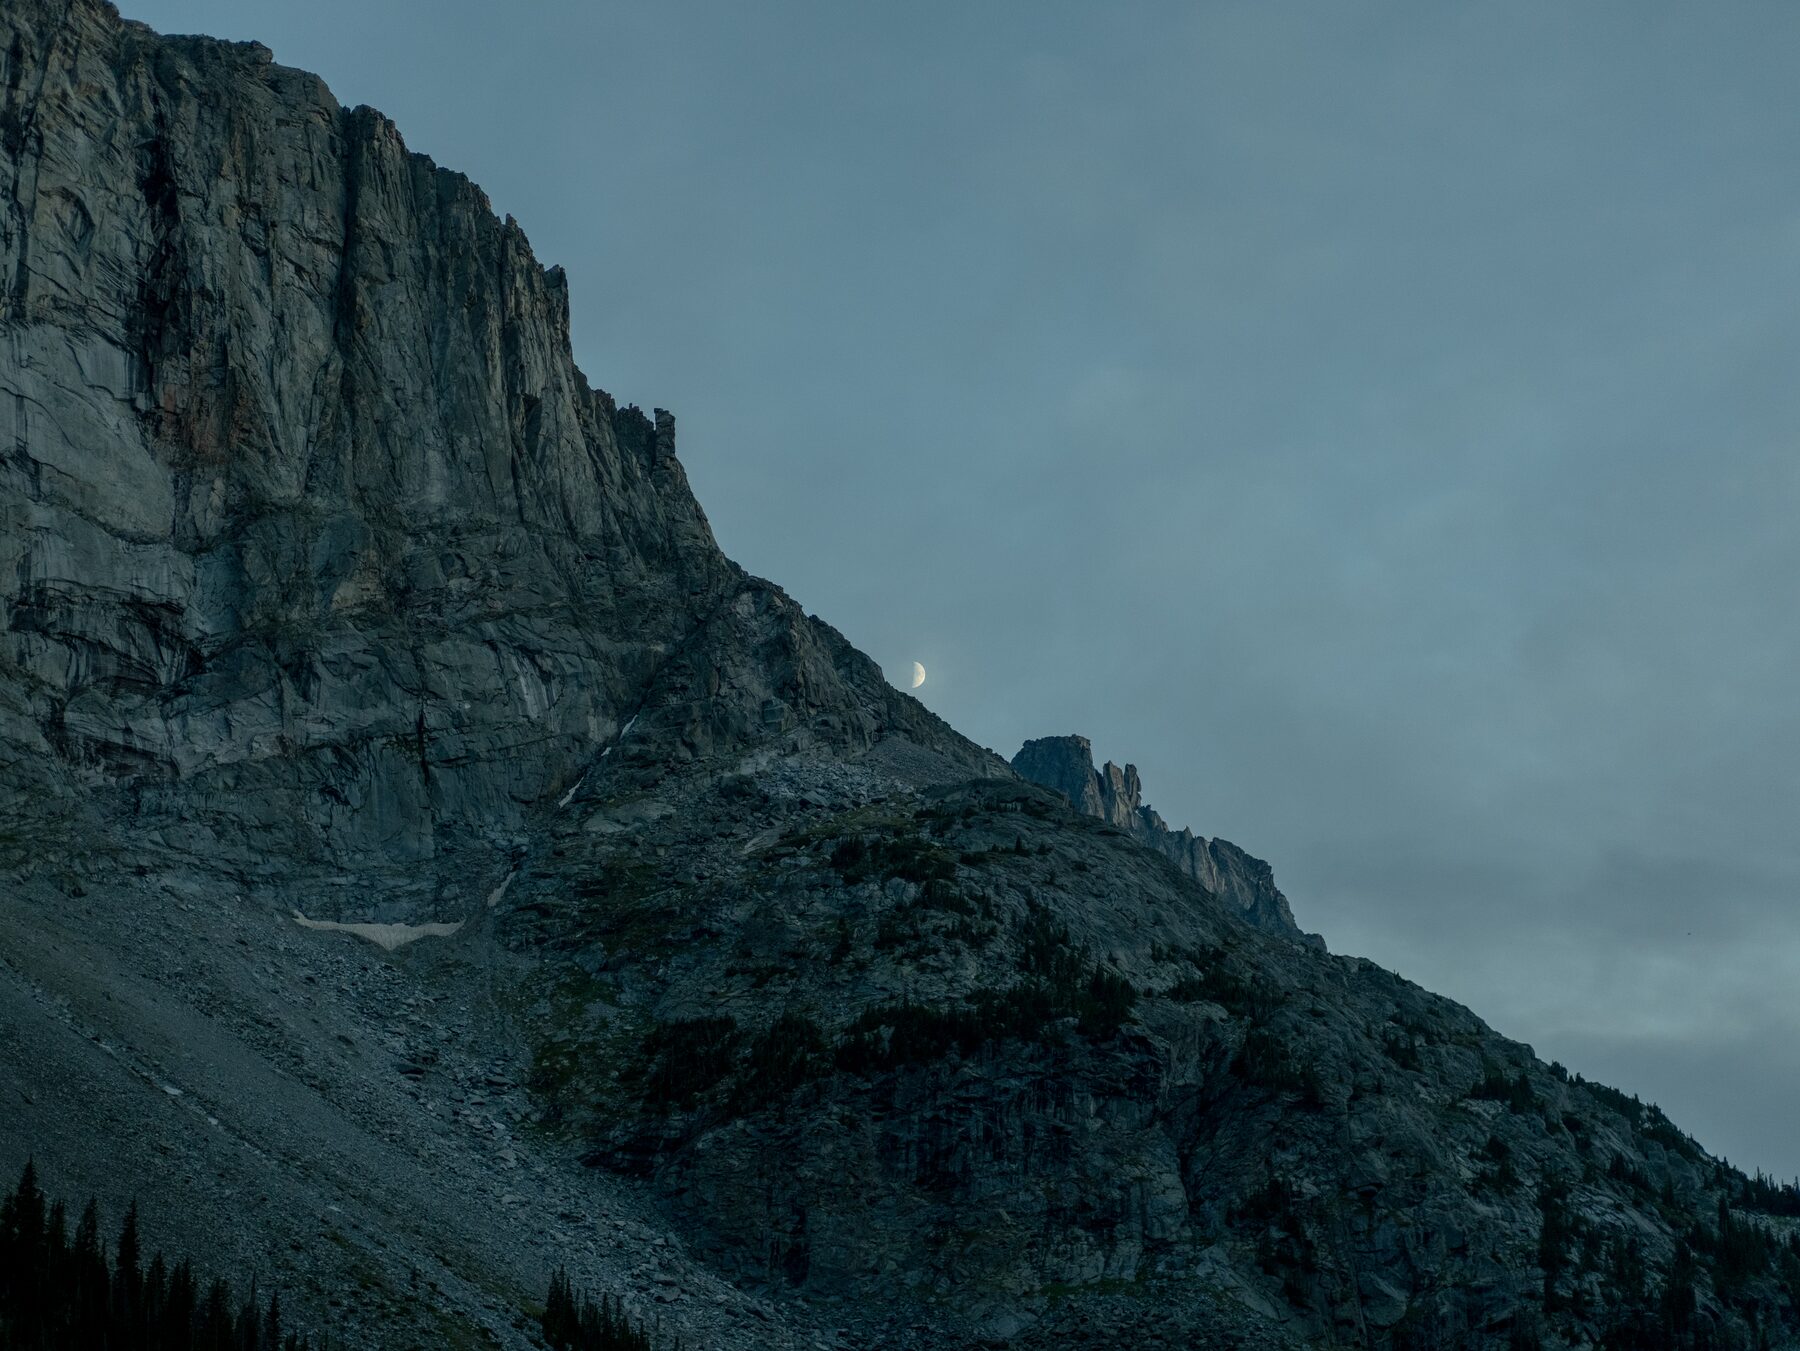
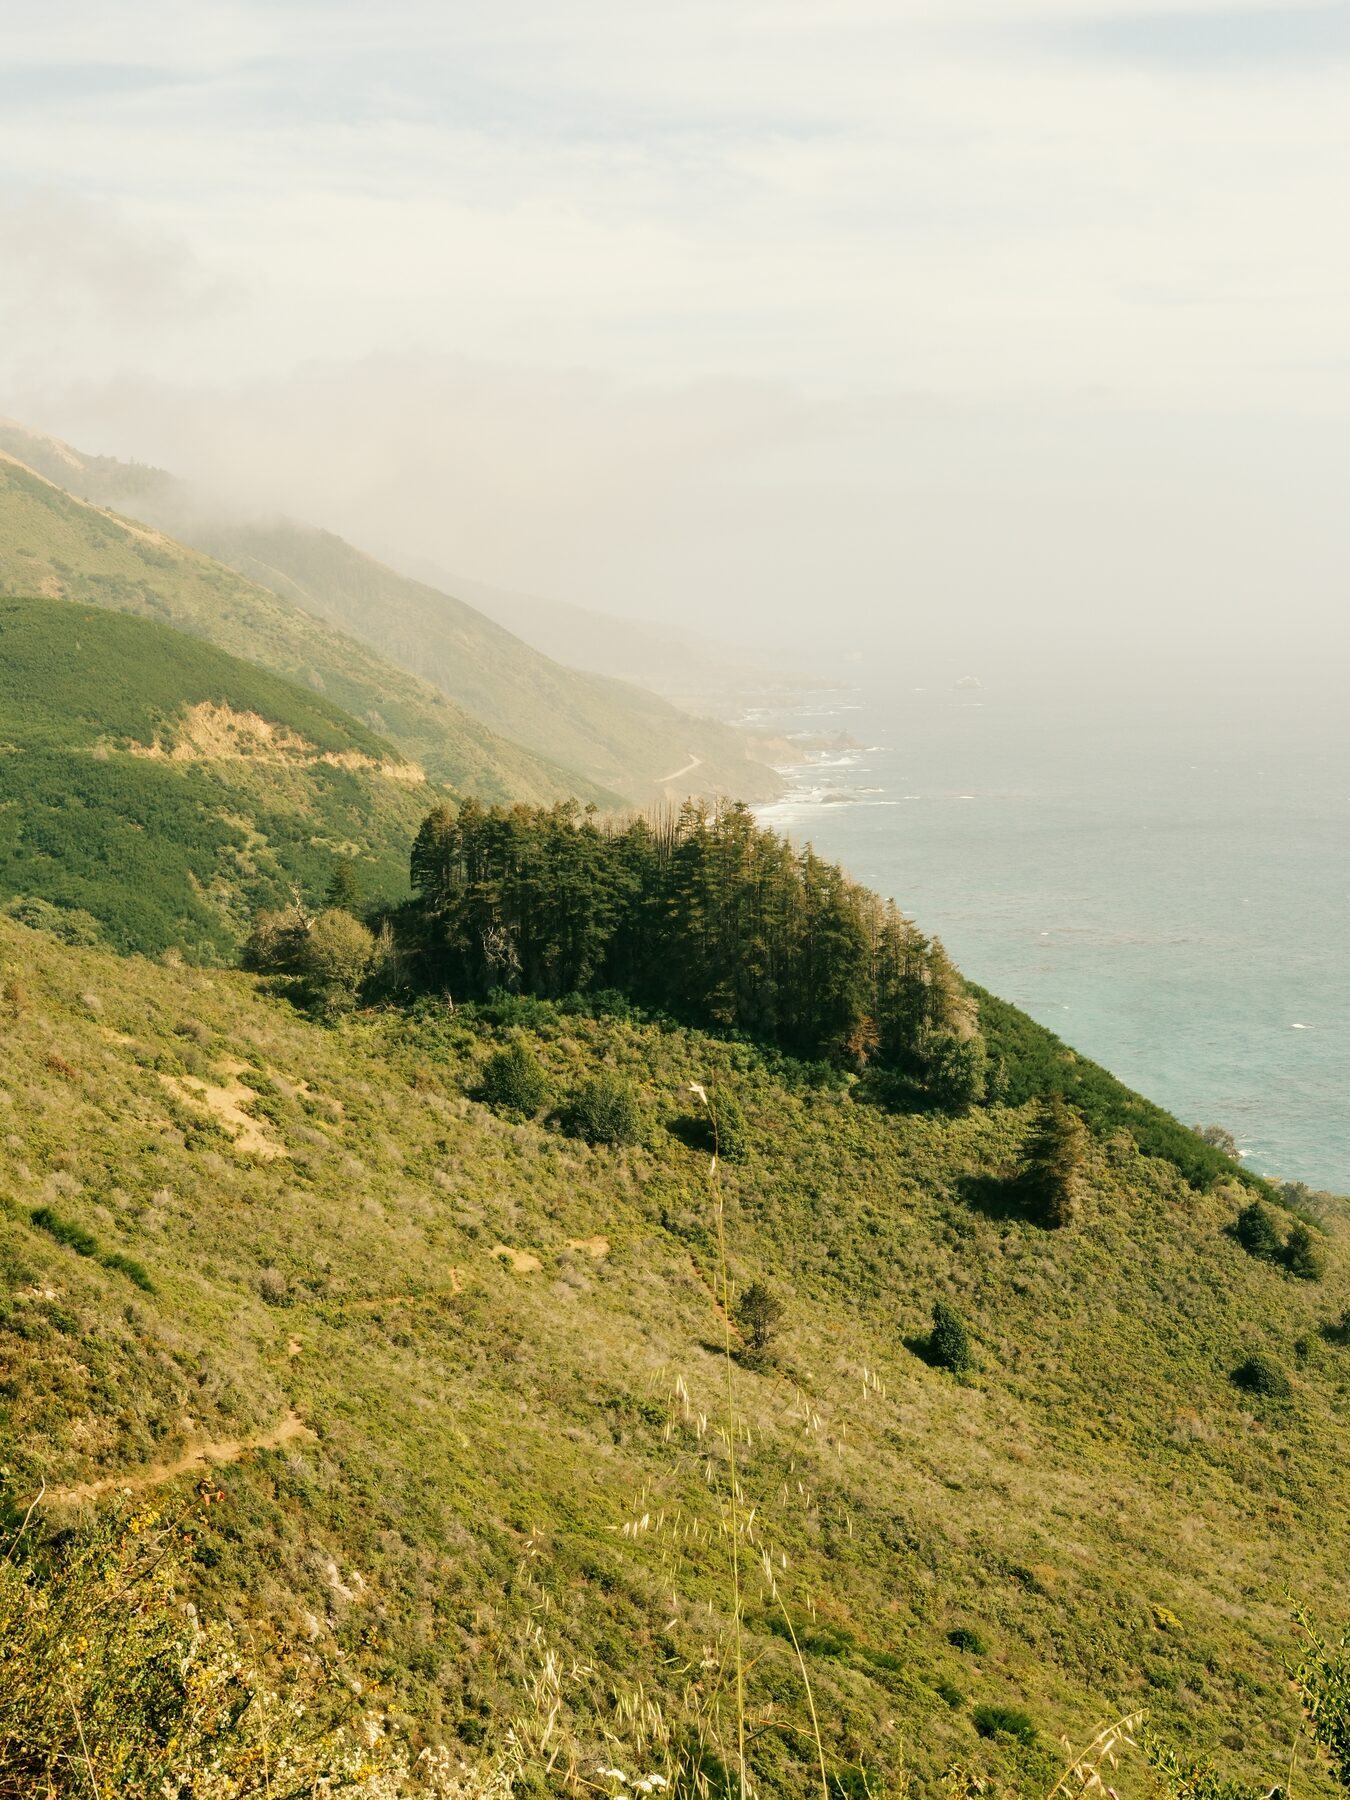
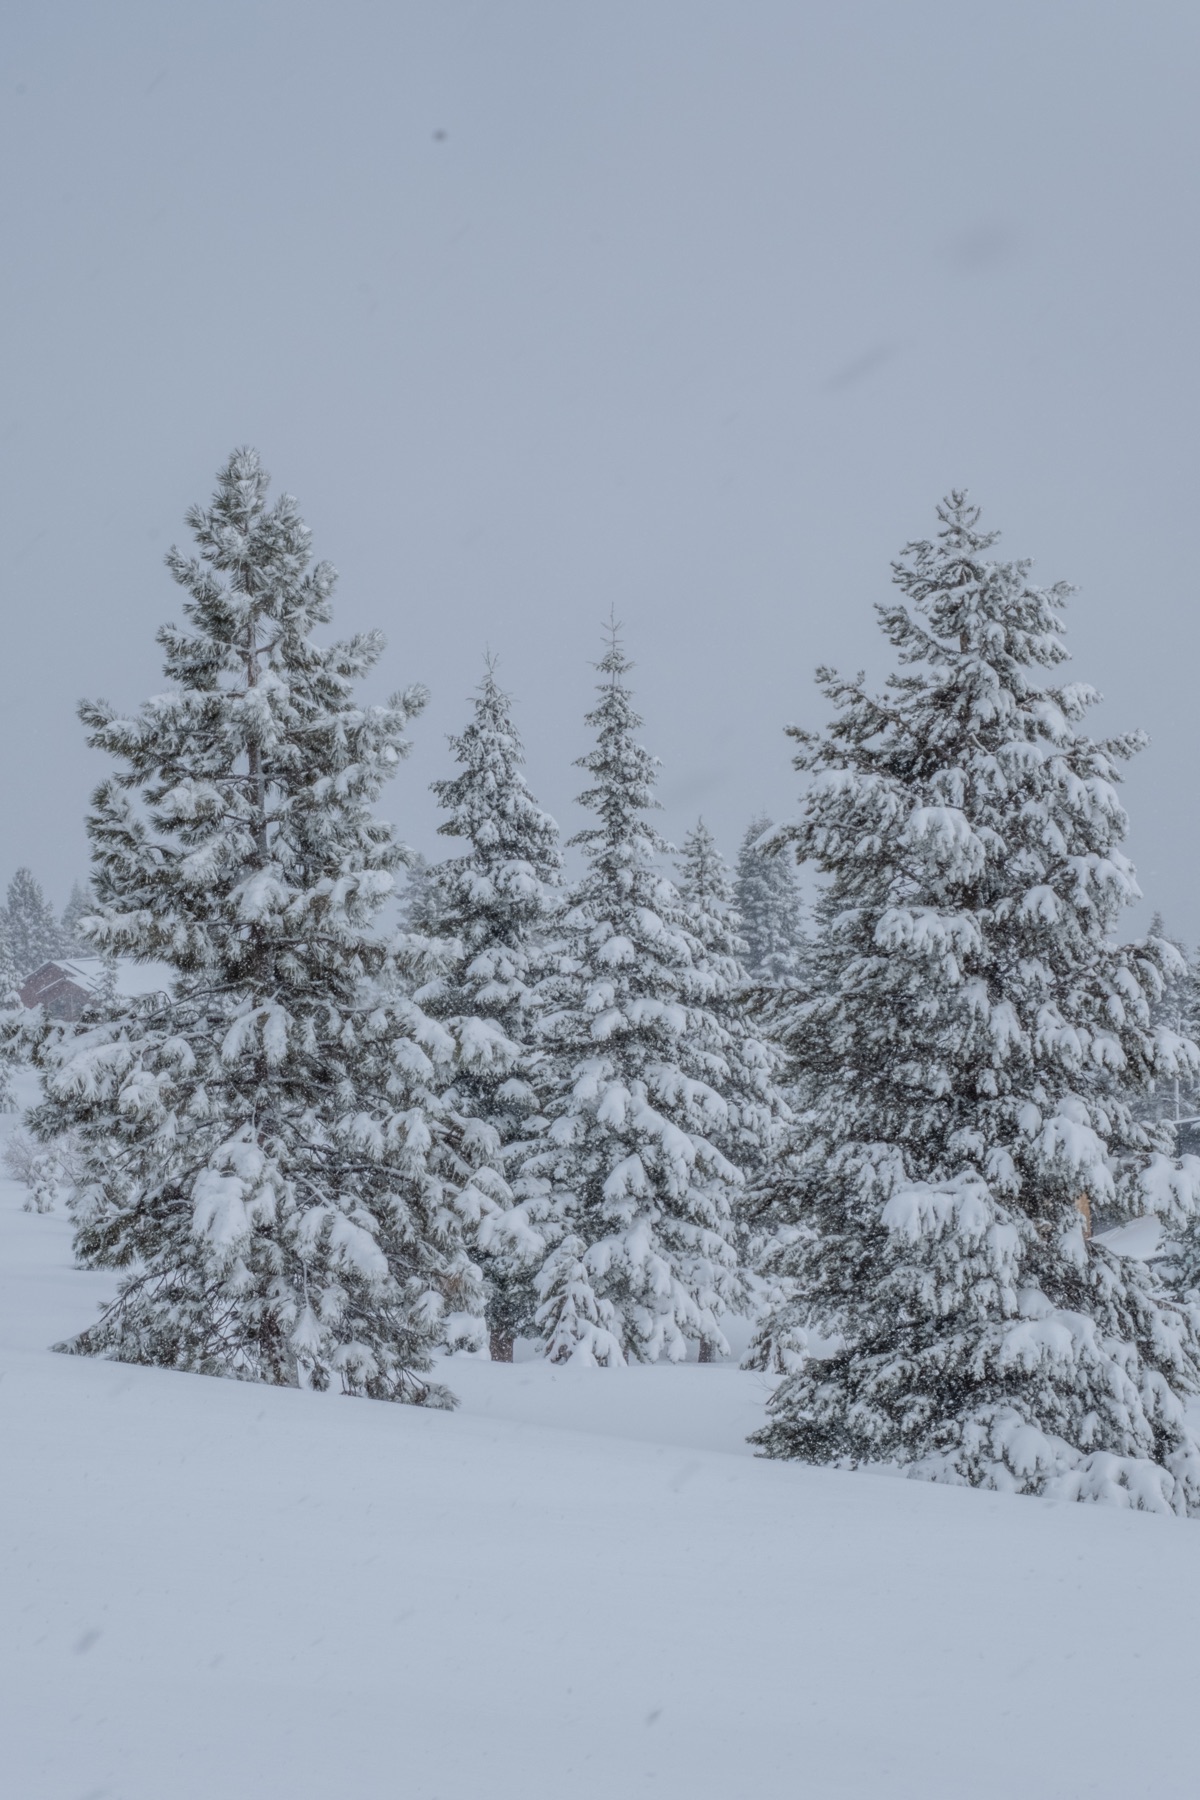
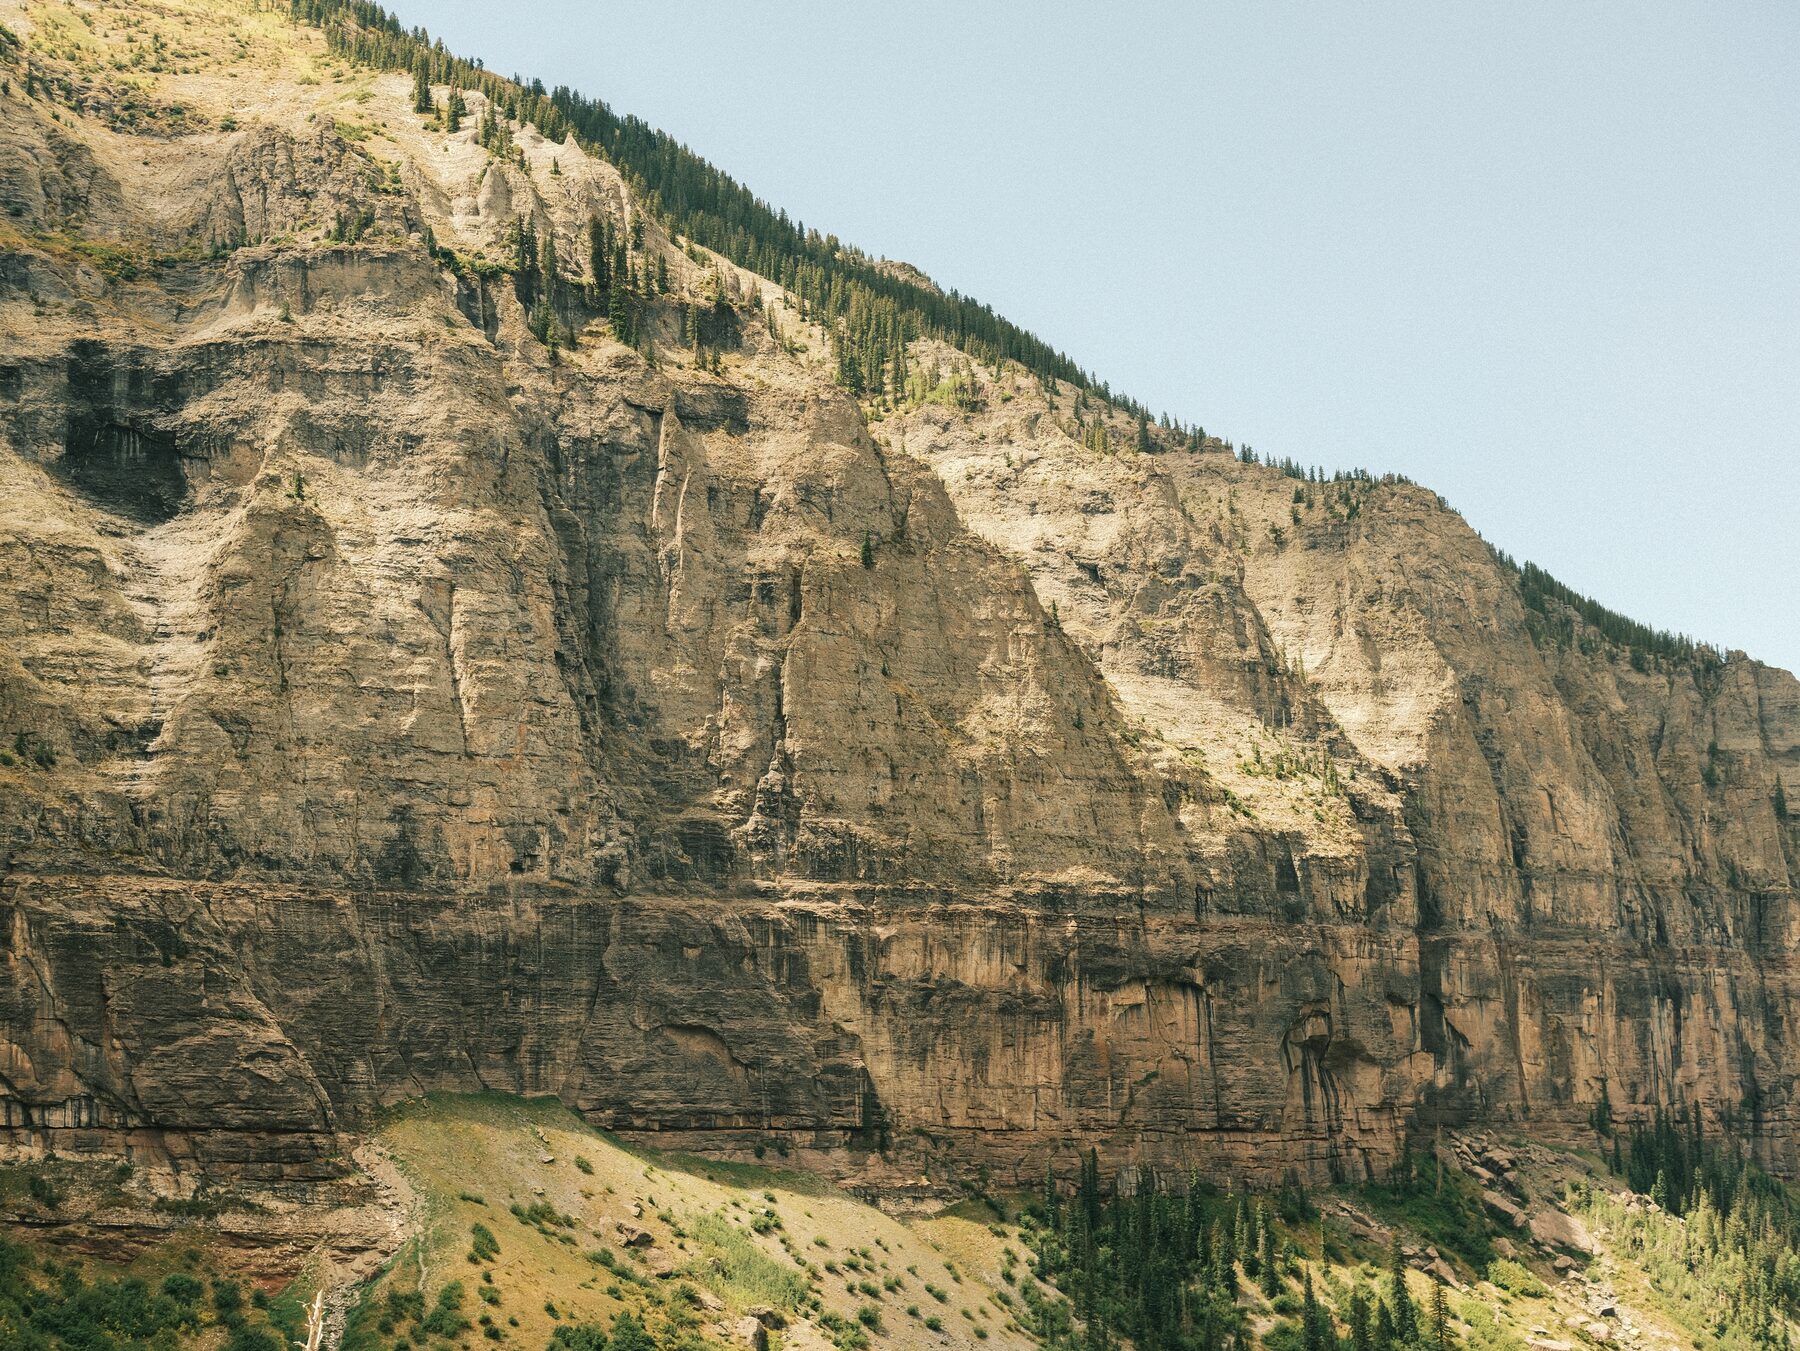
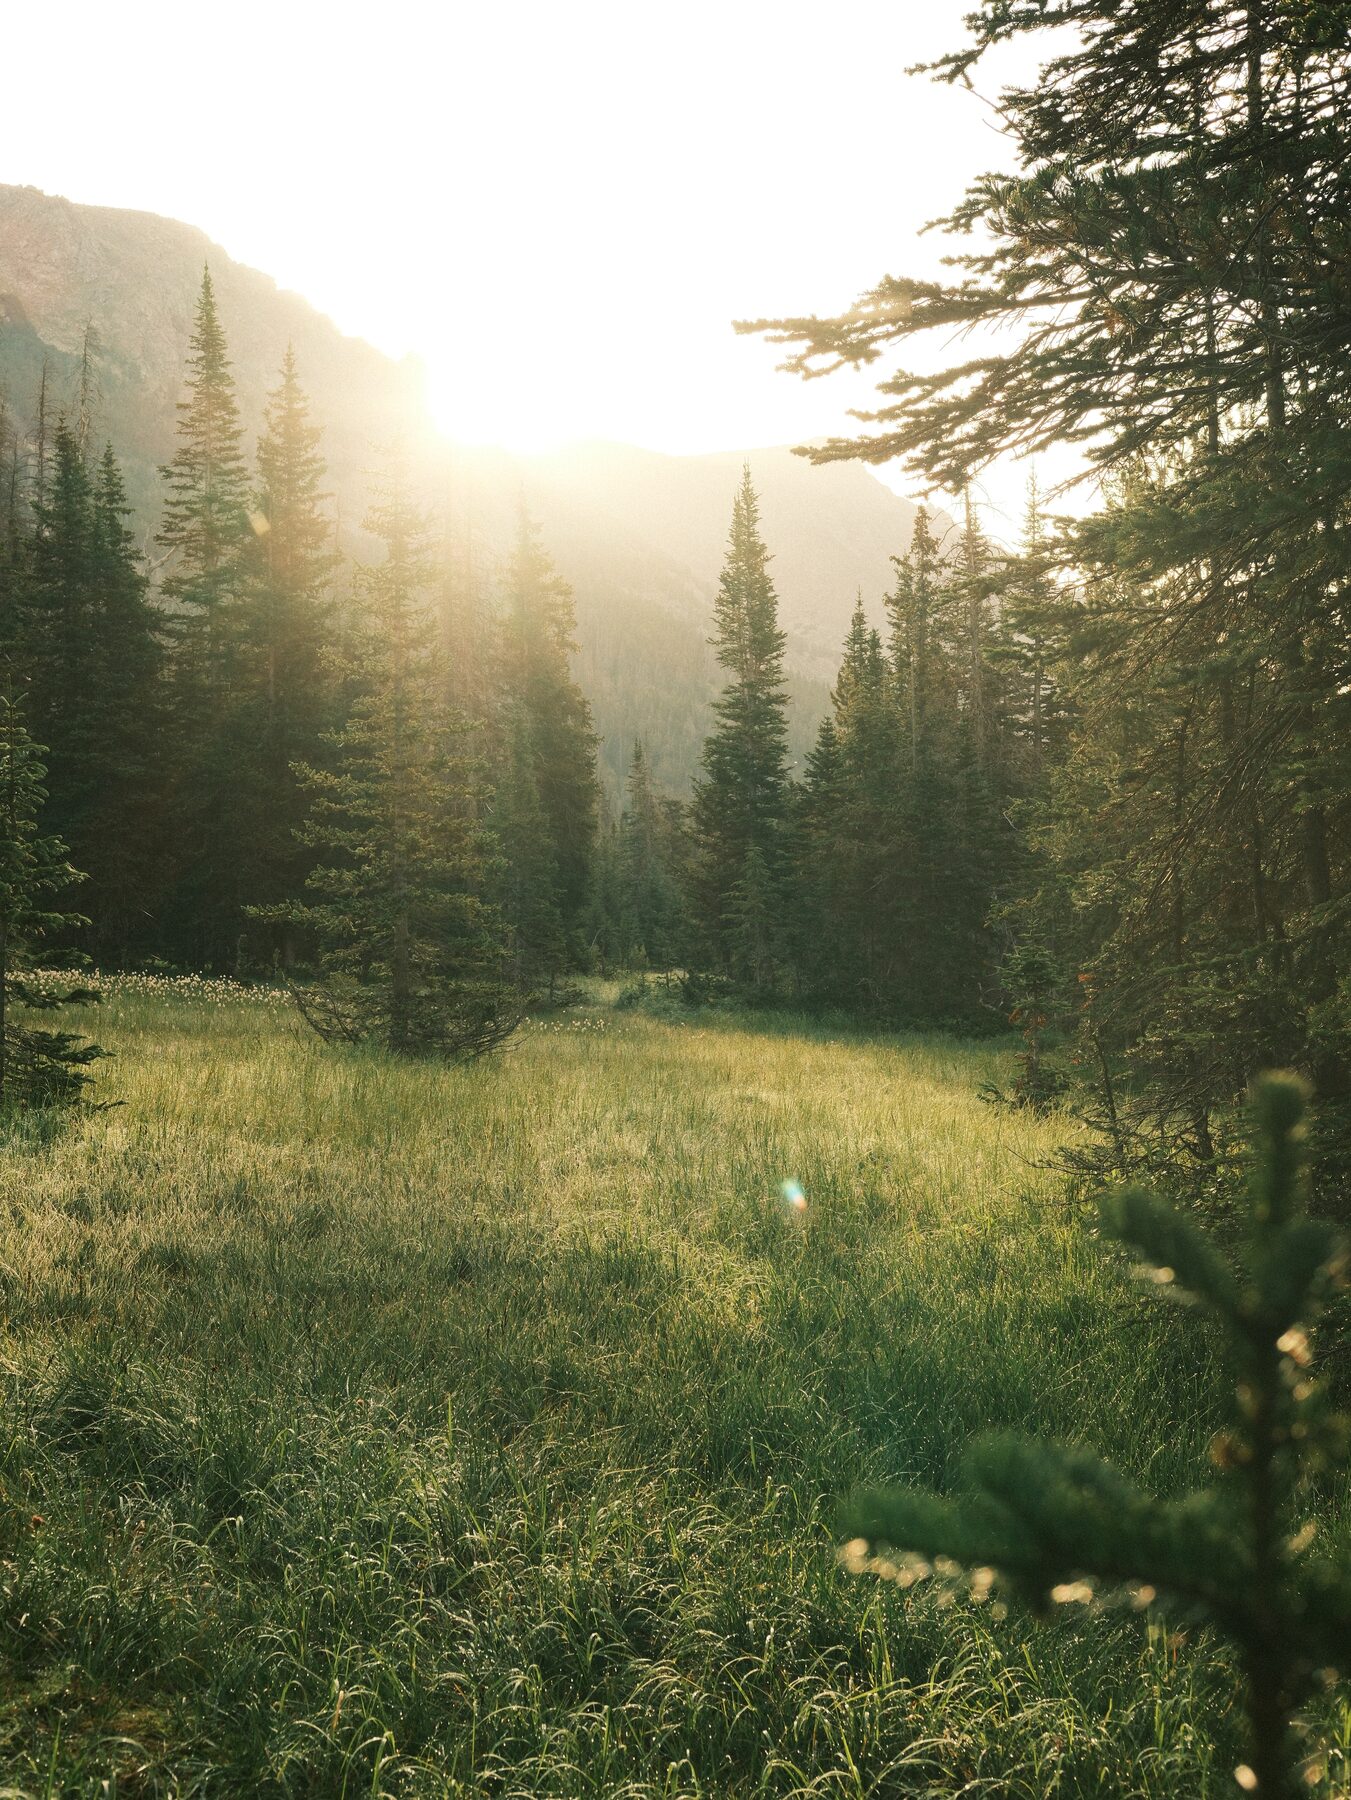
Landscapes from the last few years. Everything on this site, including the photographs behind my name up top, is mine. Click any of them to see it larger.

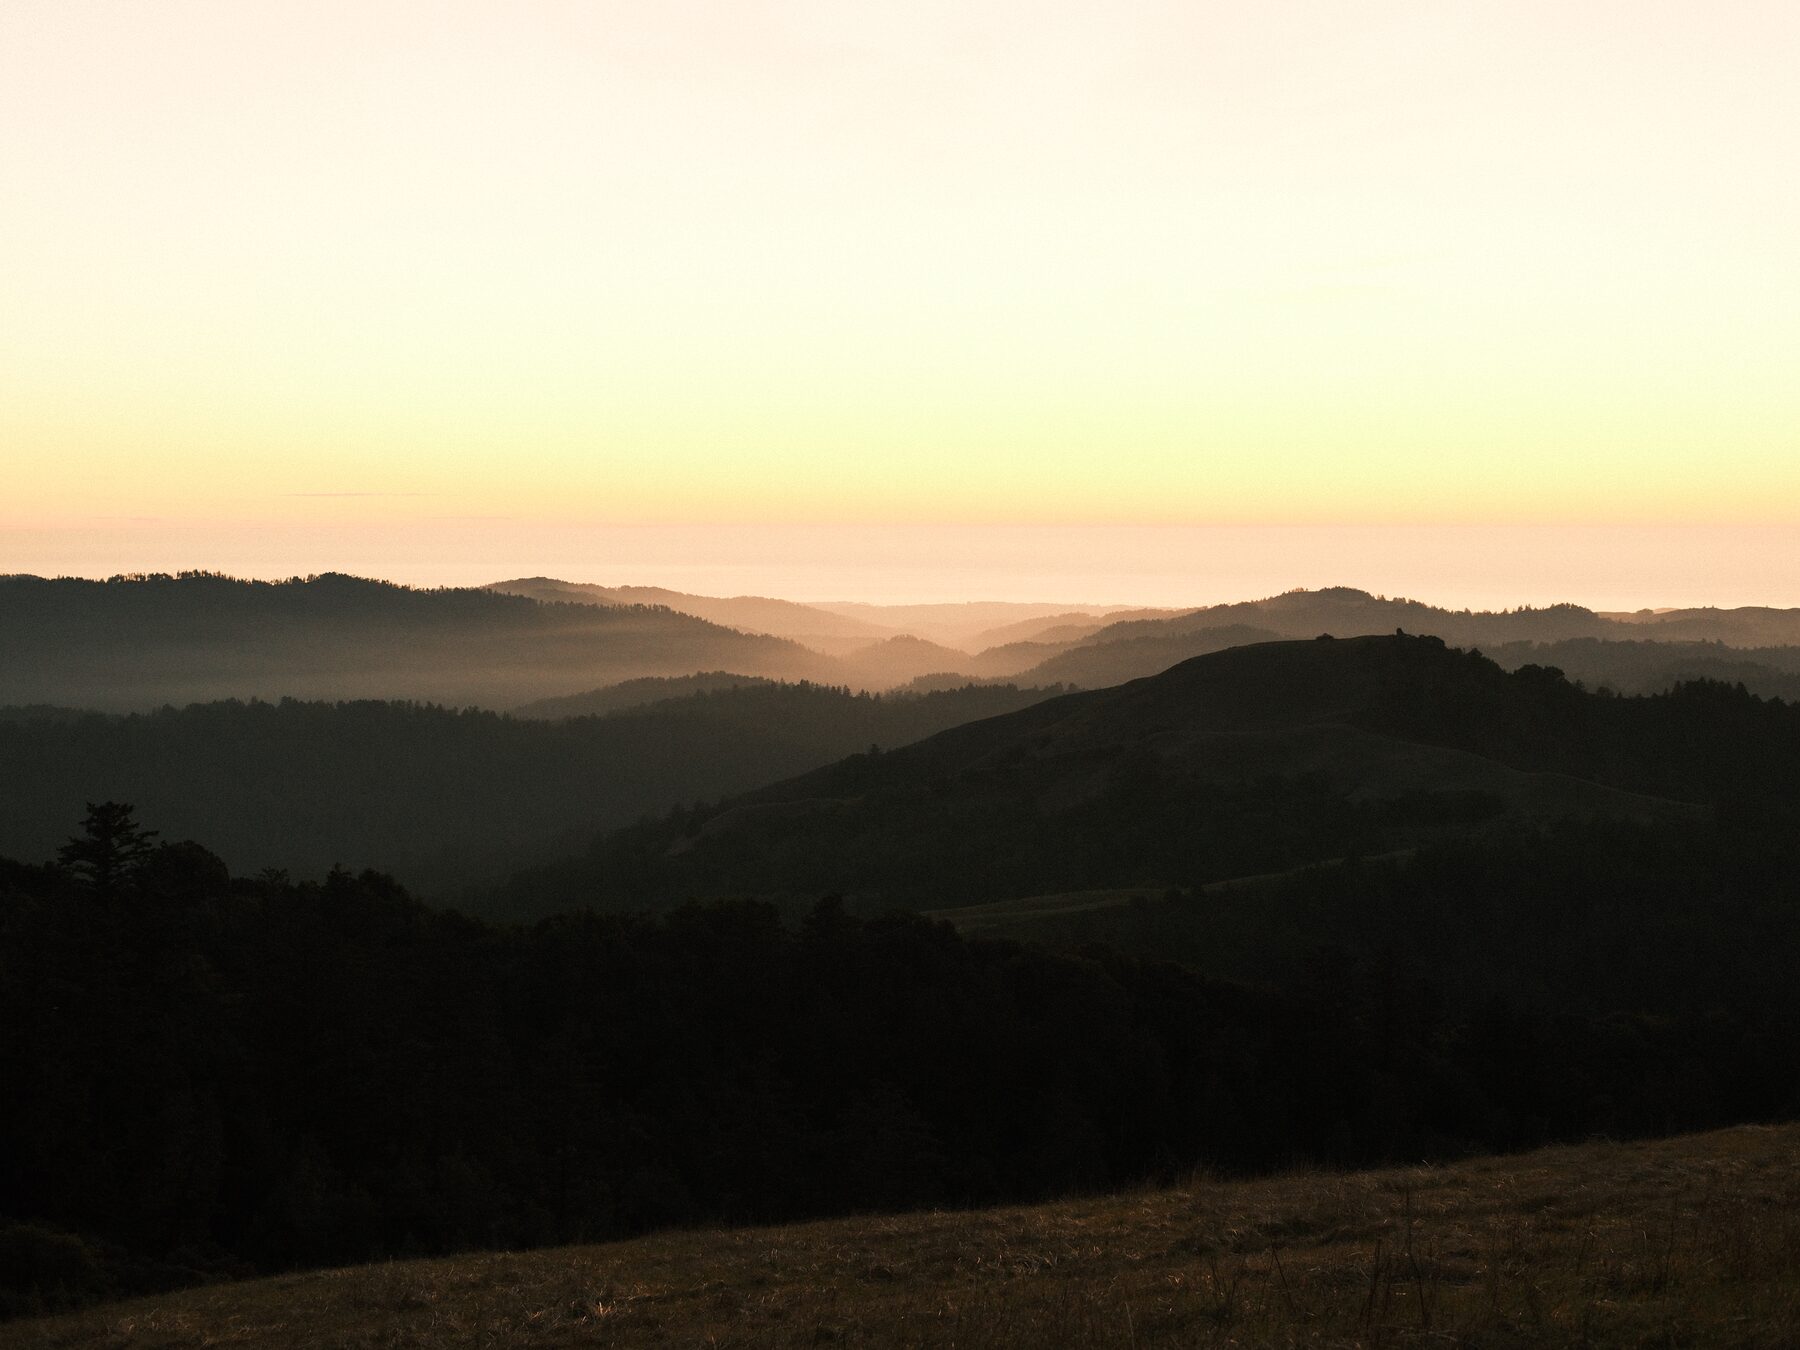
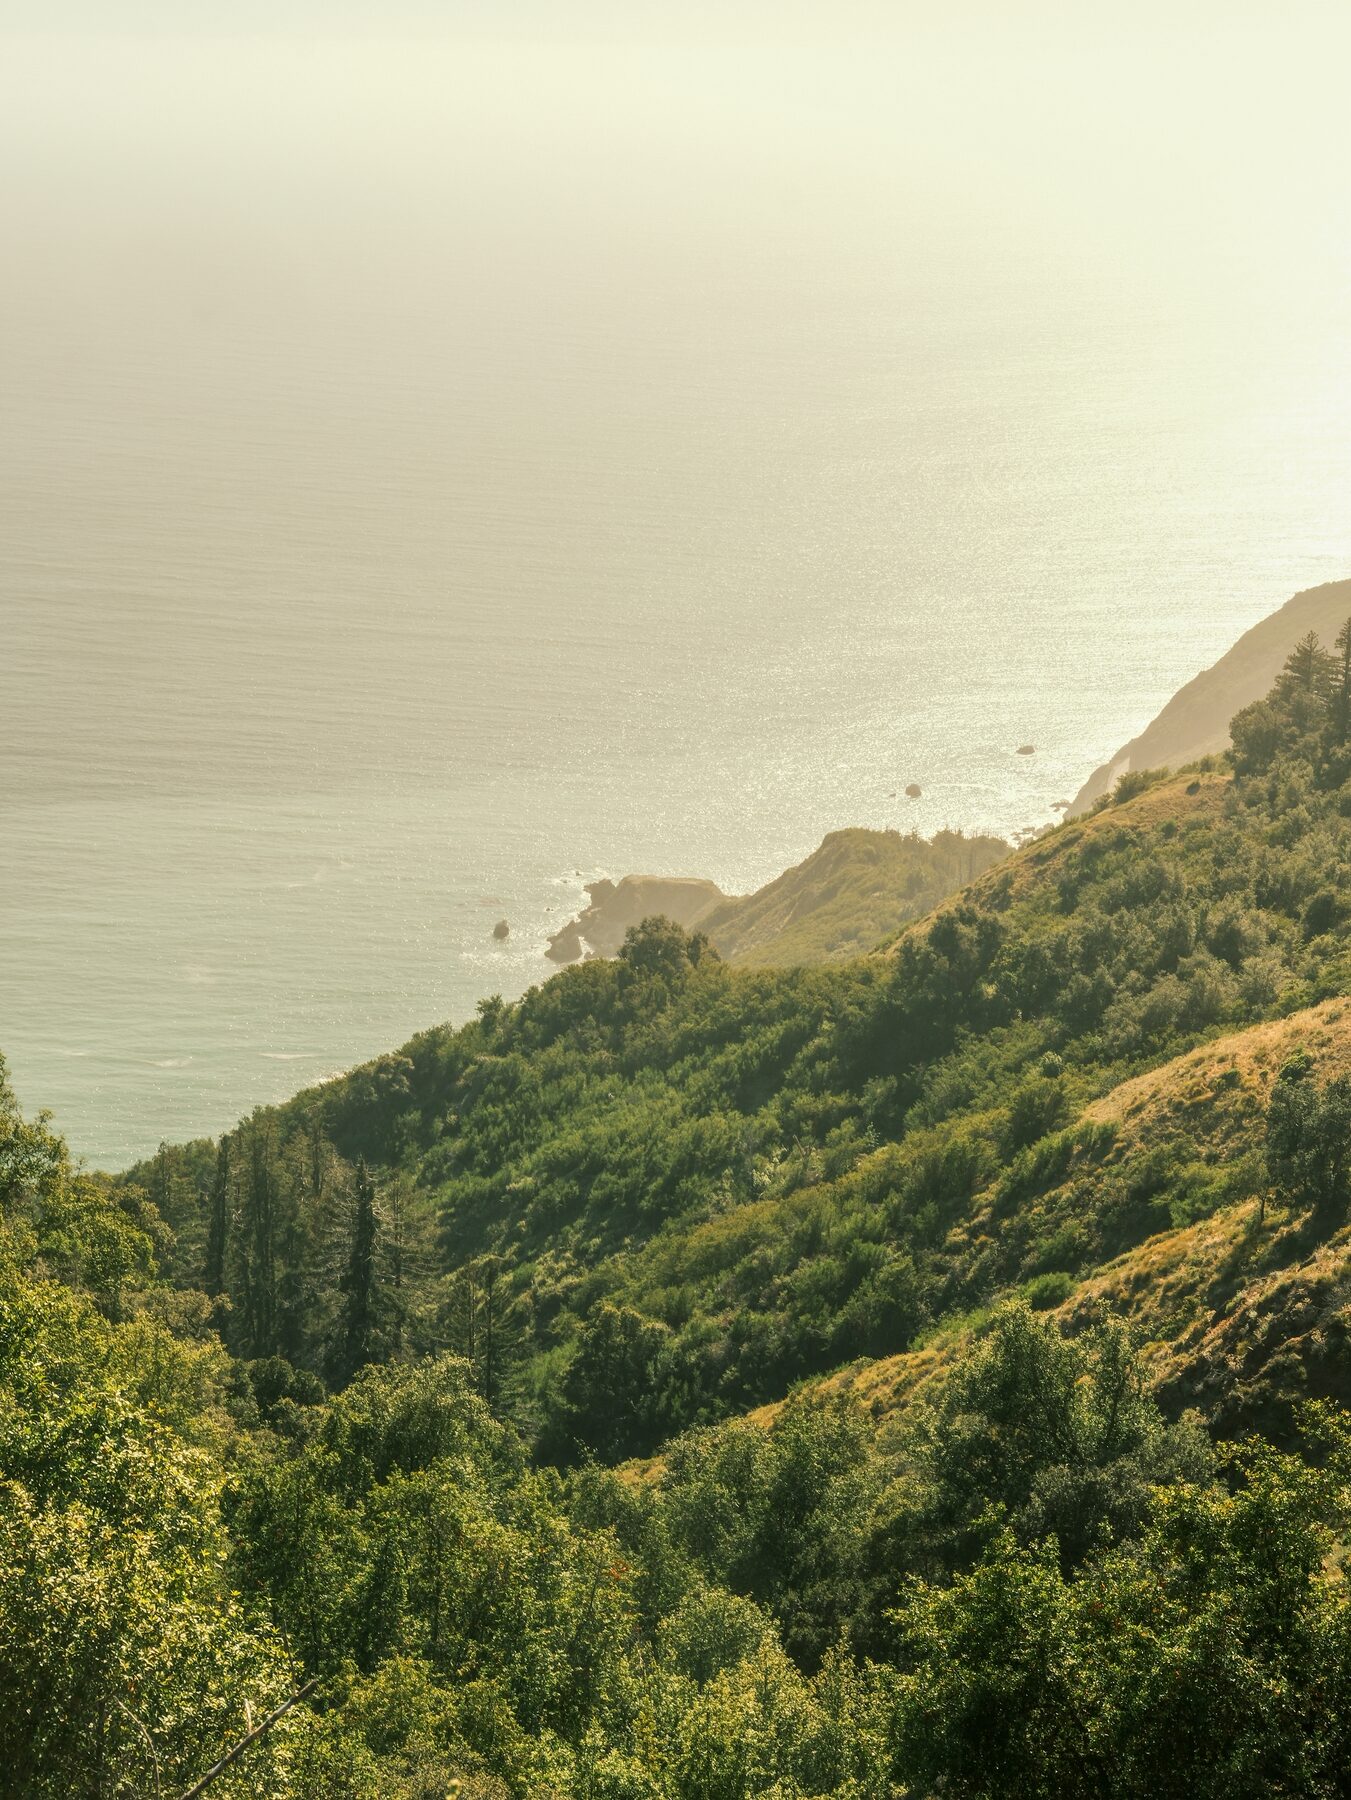
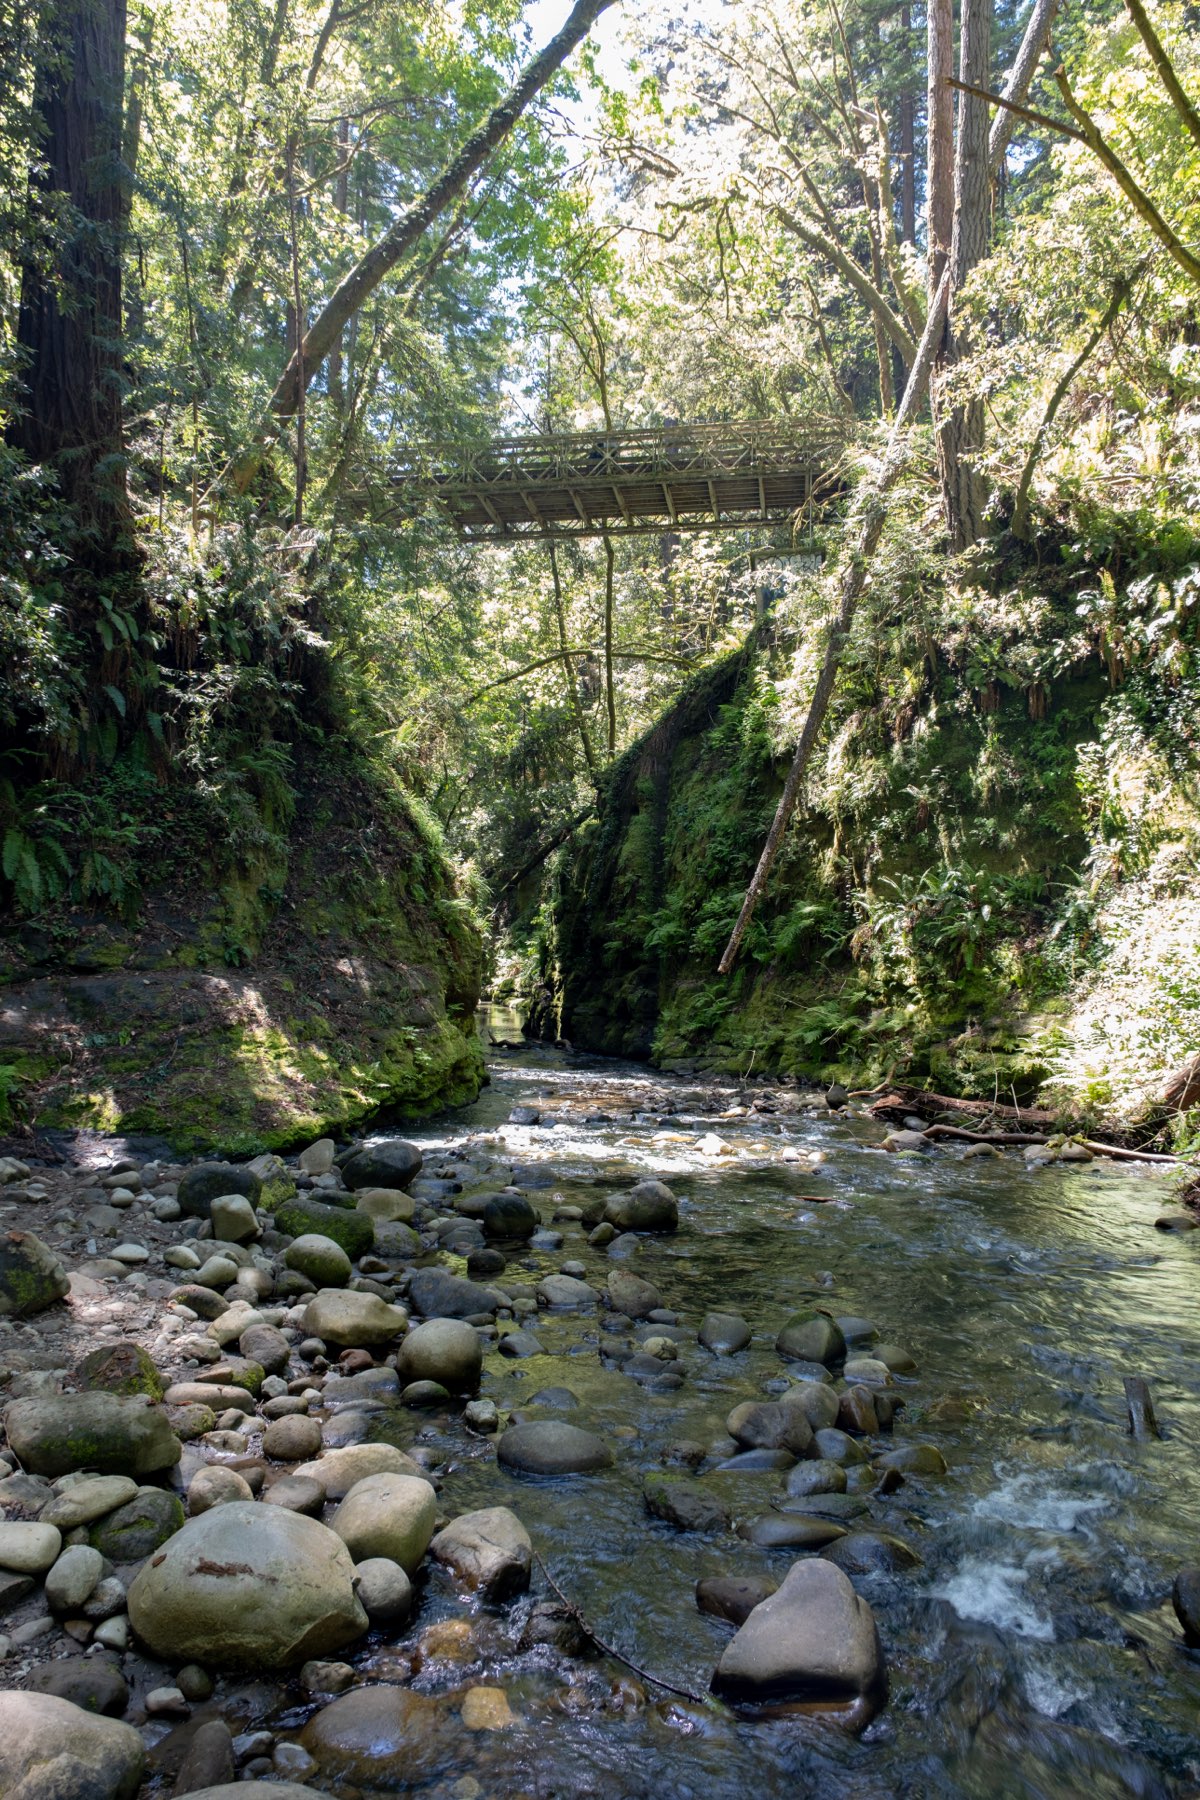
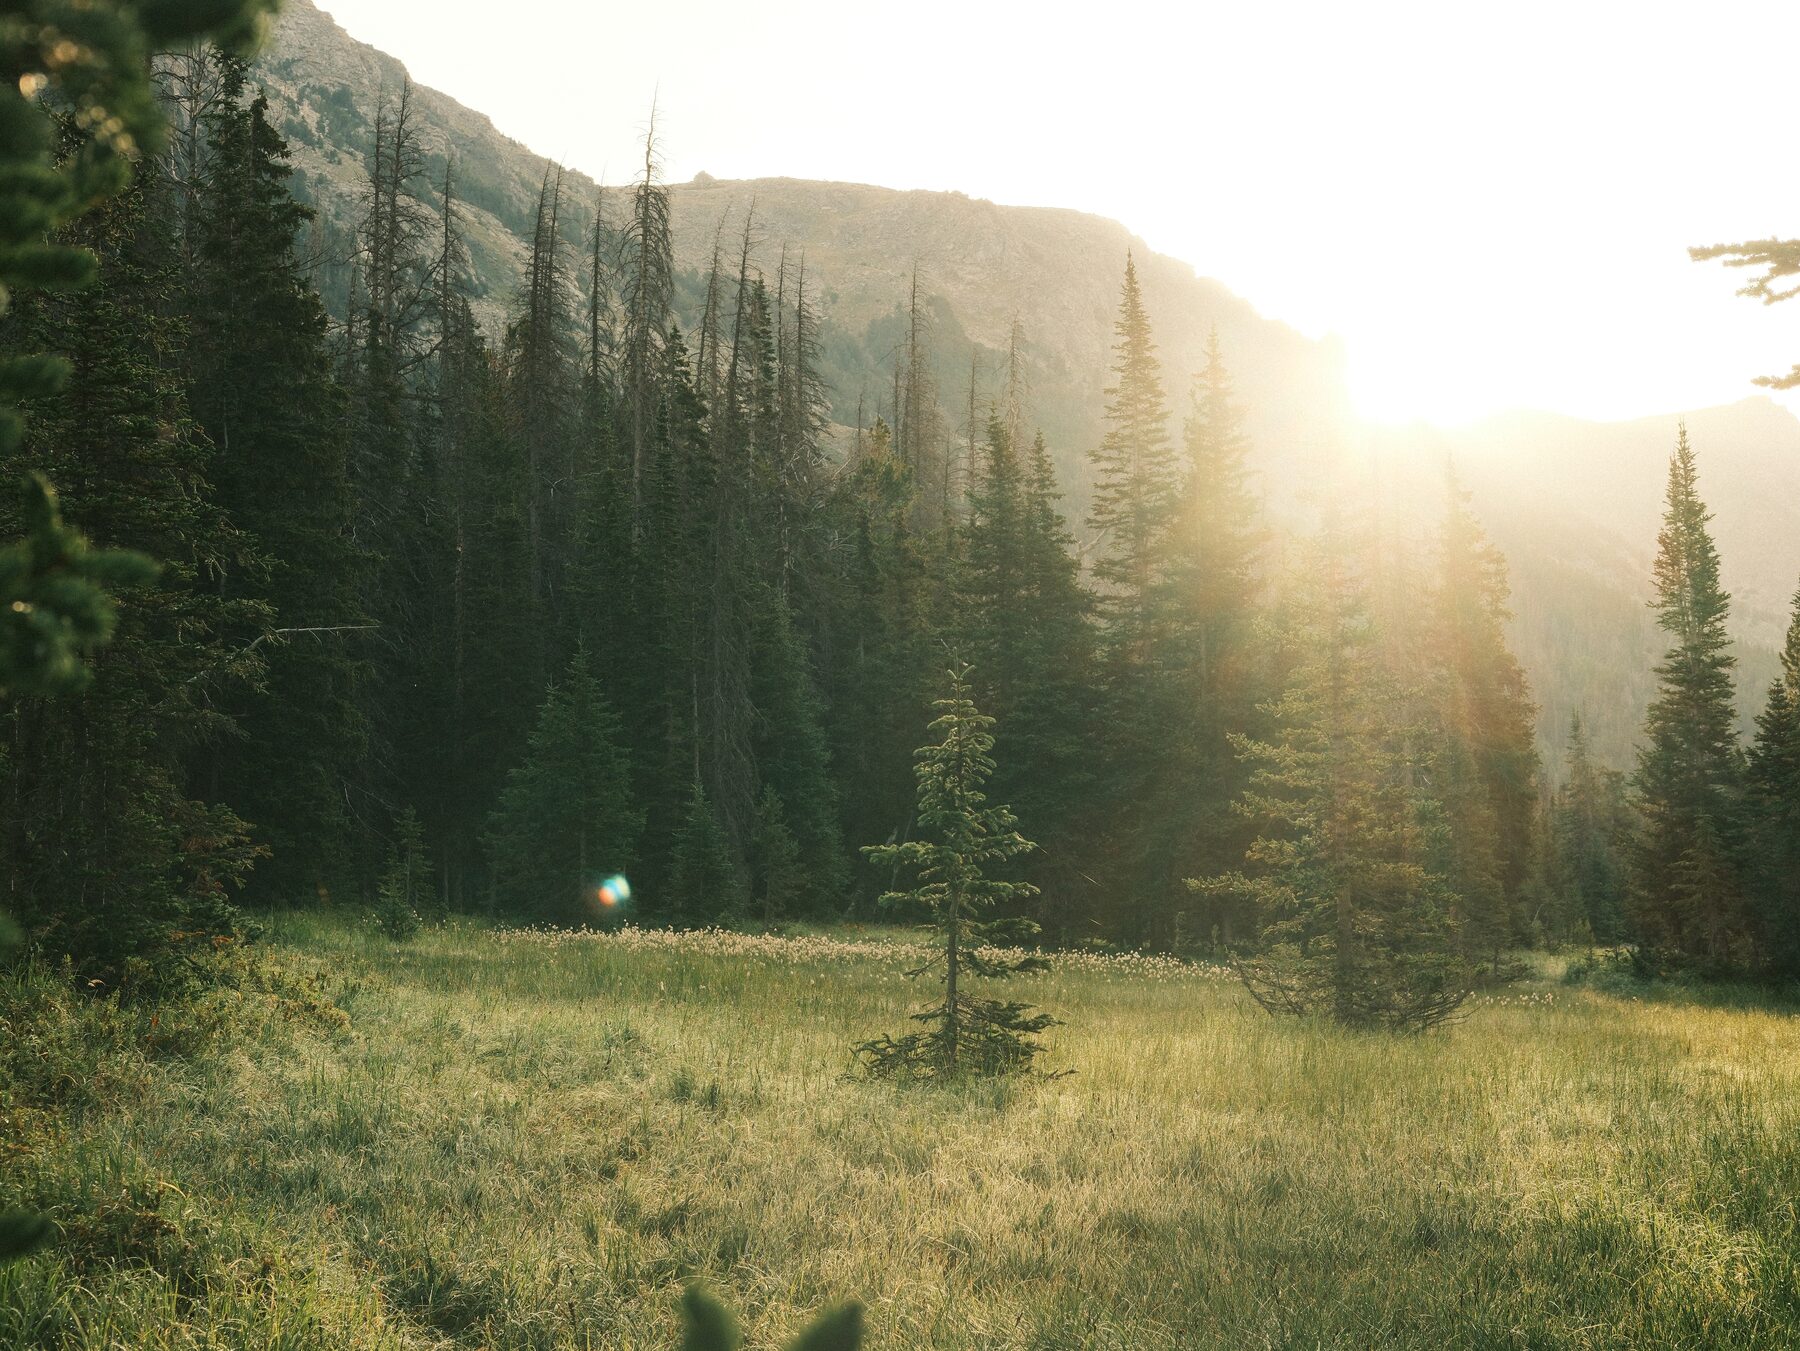
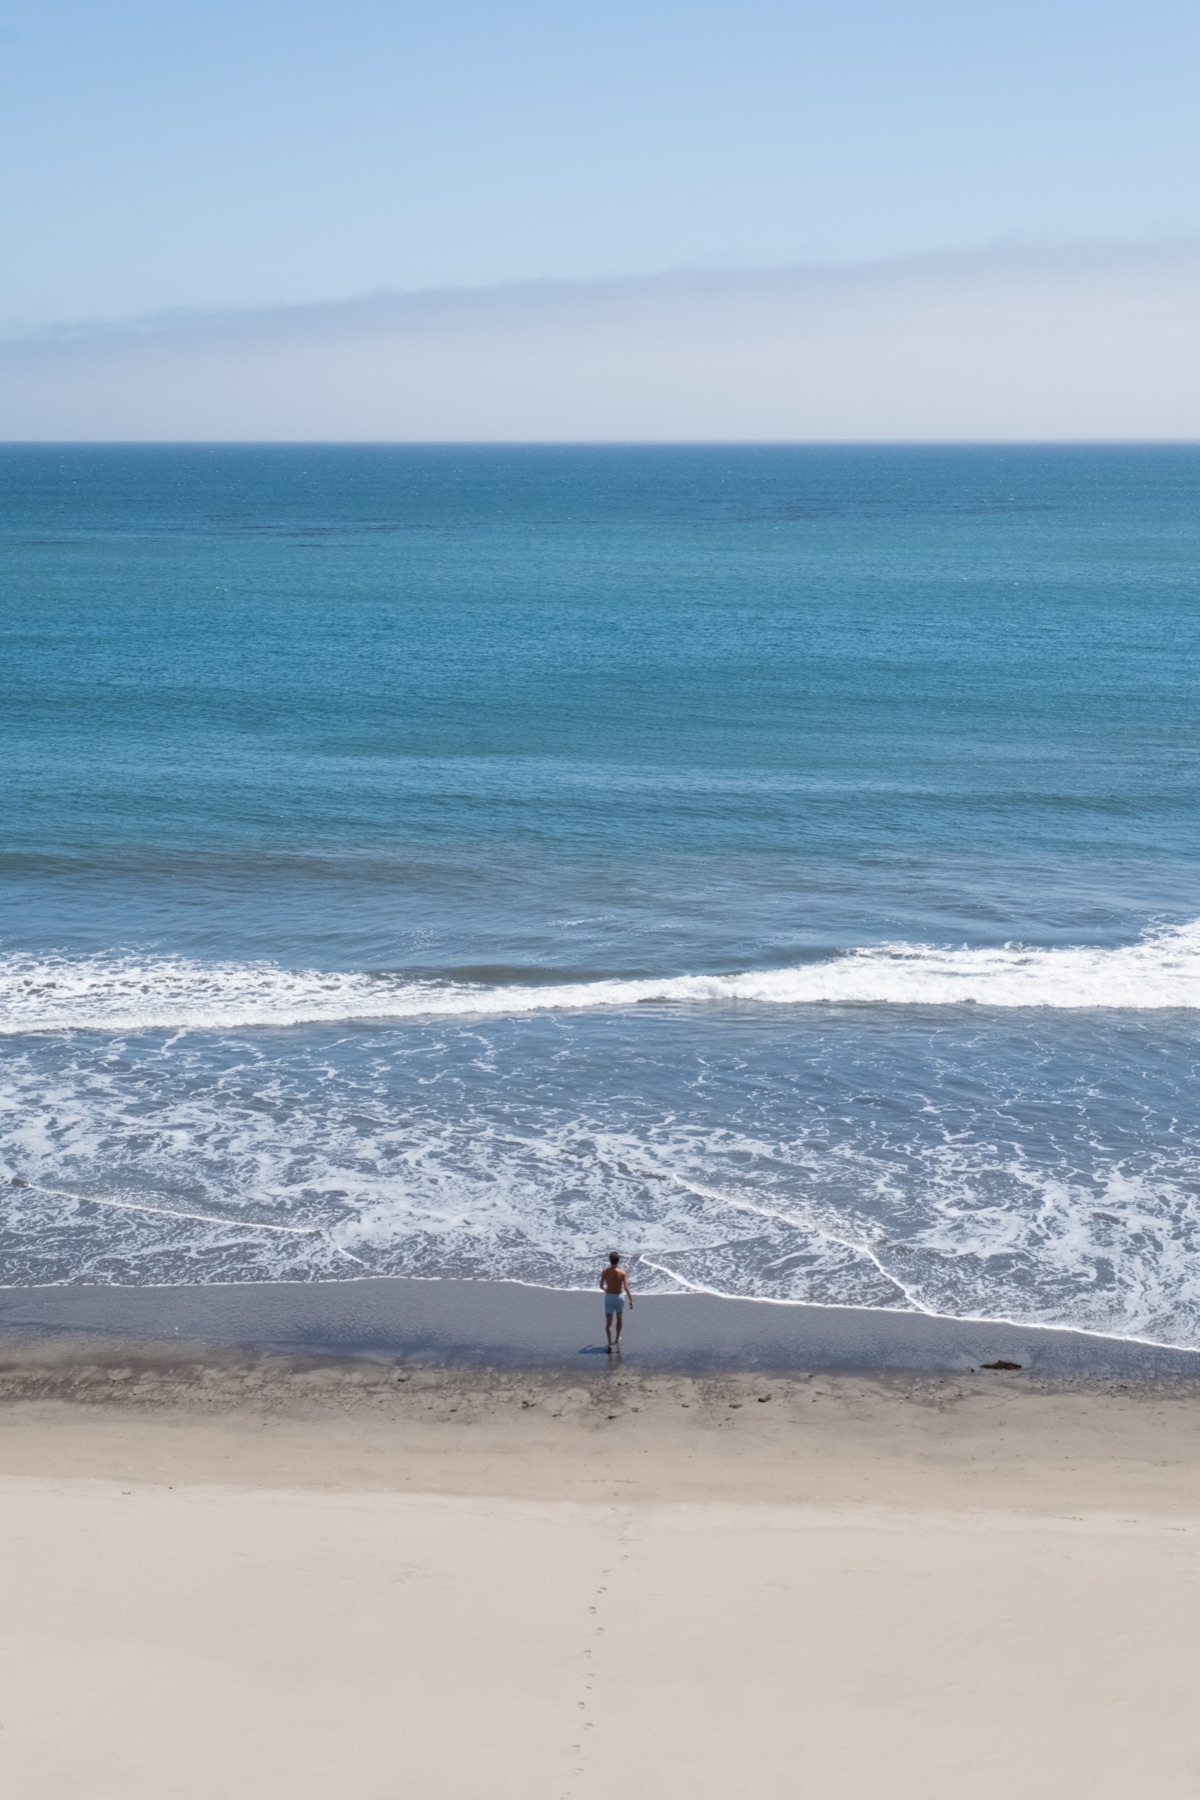
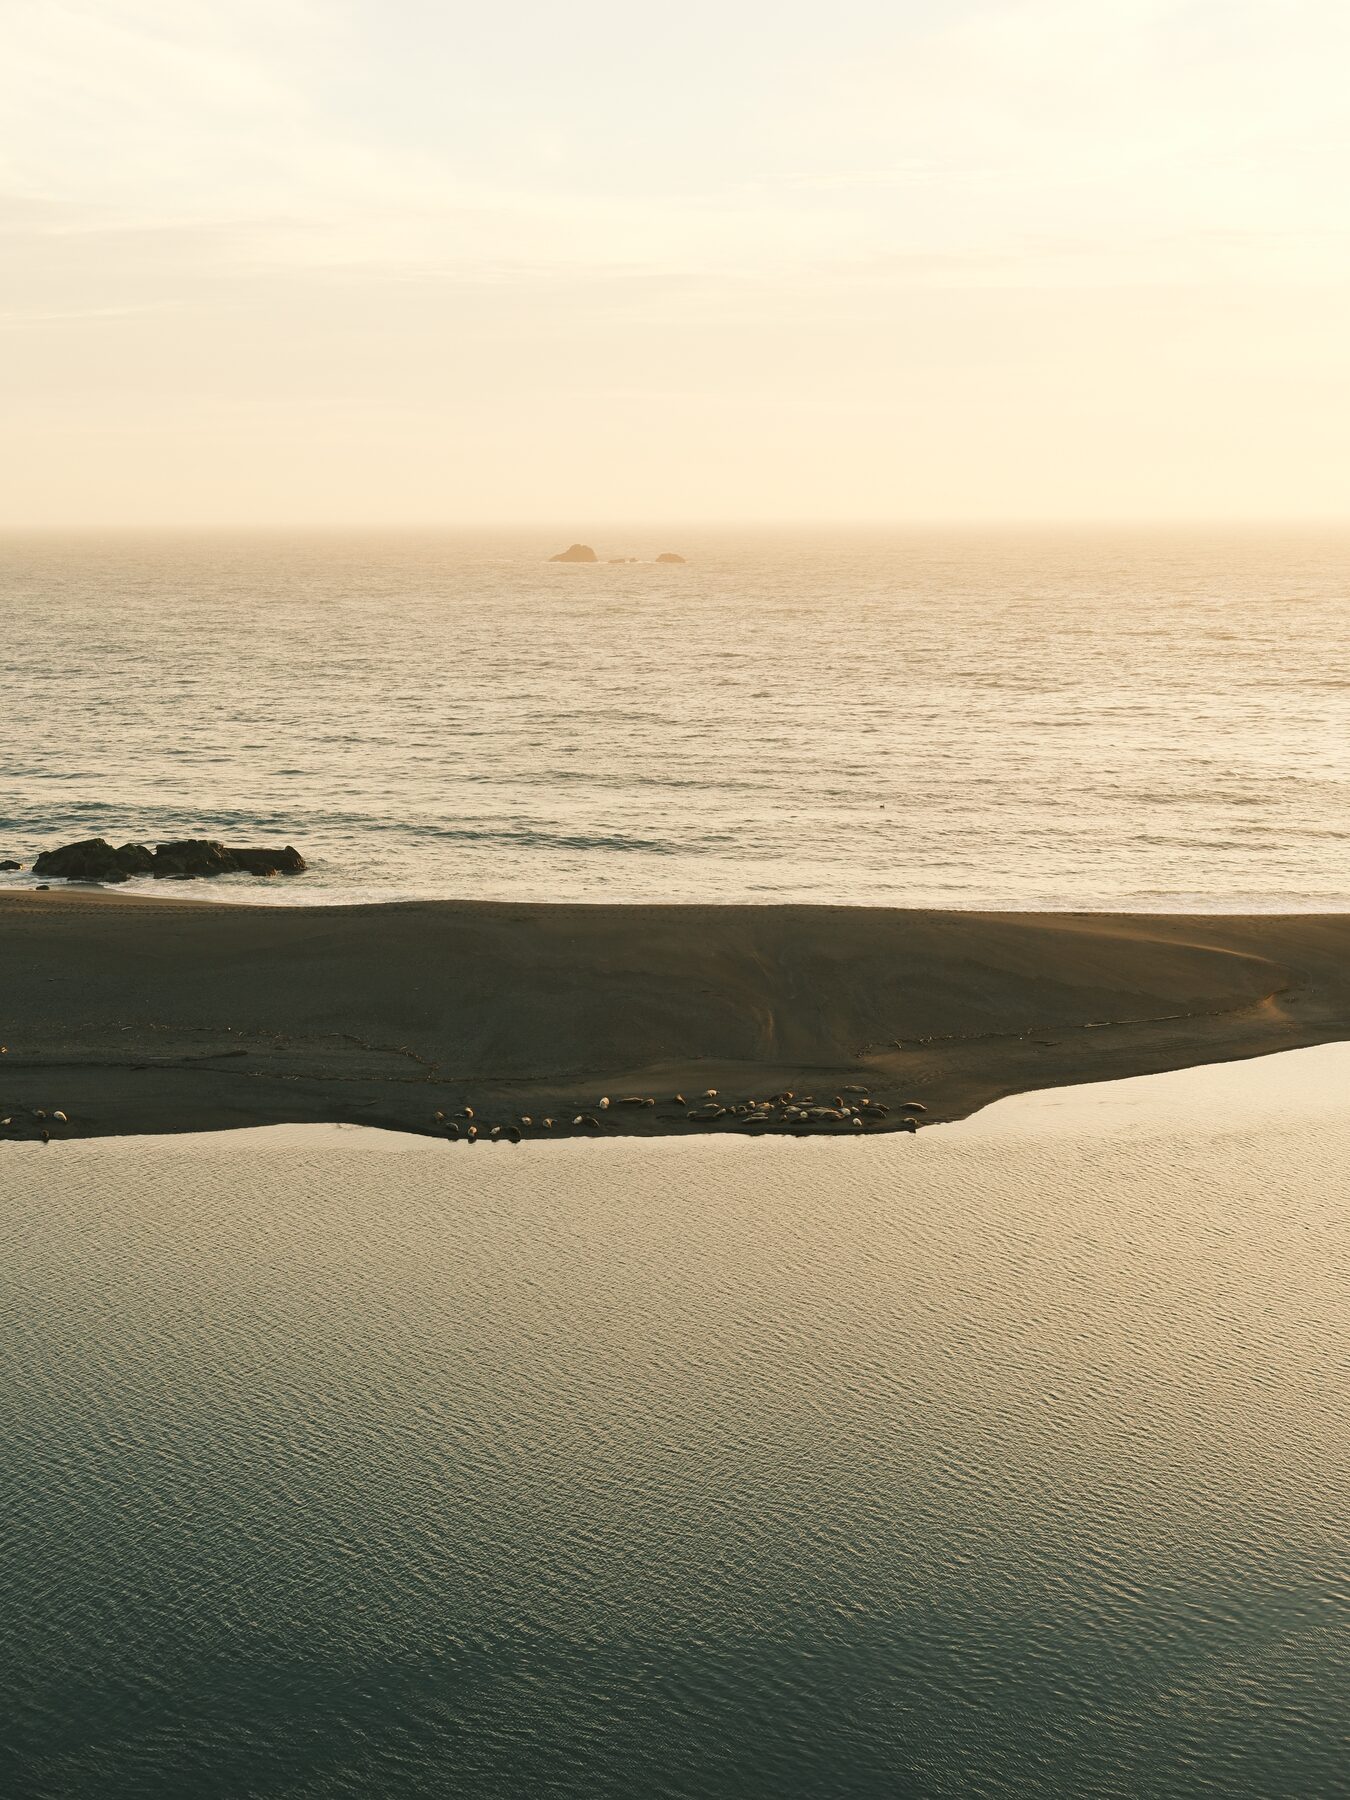
Green valley between steep mountain walls above Telluride, Colorado Rocky peak with clouds hanging on its shoulder at dusk Pink and violet sunset reflected in wet sand ribbed by the outgoing tide Sea stacks on a glassy tidal flat at sunset Layered ridgelines under an orange sky Big Sur hills dropping into the Pacific Rocky creek running through a fern-covered canyon under a footbridge Sunrise through pines over a high mountain meadow Switchbacks climbing toward a waterfall in a box canyon near Telluride Pink dusk over dry grass and distant valley lights Two birds crossing a lavender sky above pink-lit clouds Blue granite face in evening shadow Big Sur coastline fading into haze Snow-loaded pines in a whiteout near Lake Tahoe Layered cliff band with a road cut along its base Low sun flaring through trees into a green meadow A lone swimmer at the edge of the surf, seen from the bluff above a wide blue ocean Dark sand spit dividing calm water from the ocean